LANZHOU_CITY


Location

lon / lat [deg]: 103.8534 / 36.0481

Source network: AERONET


Geostationary surface albedo (GSA) data


“+000”


“+057/+063”


Landcover information (based on ESA CCI landcover data)


Landcover fractions @ 2km distance


Landcover fractions @ 20 km distance


Legend


Distance to open water bodies [km]:

1.97

Distance to urban areas [km]:

0.09


Radius: 1 km

Number of landcover classes:

1

Dominant landcover type:

190: urban areas

Fraction of dominant landcover type [%]:

100.0


Radius: 2 km

Number of landcover classes:

1

Dominant landcover type:

190: urban areas

Fraction of dominant landcover type [%]:

99.0


Radius: 5 km

Number of landcover classes:

4

Dominant landcover type:

190: urban areas

Fraction of dominant landcover type [%]:

74.0


Radius: 10 km

Number of landcover classes:

6

Dominant landcover type:

130: grassland

Fraction of dominant landcover type [%]:

54.0


Radius: 20 km

Number of landcover classes:

7

Dominant landcover type:

130: grassland

Fraction of dominant landcover type [%]:

58.0


Disturbances


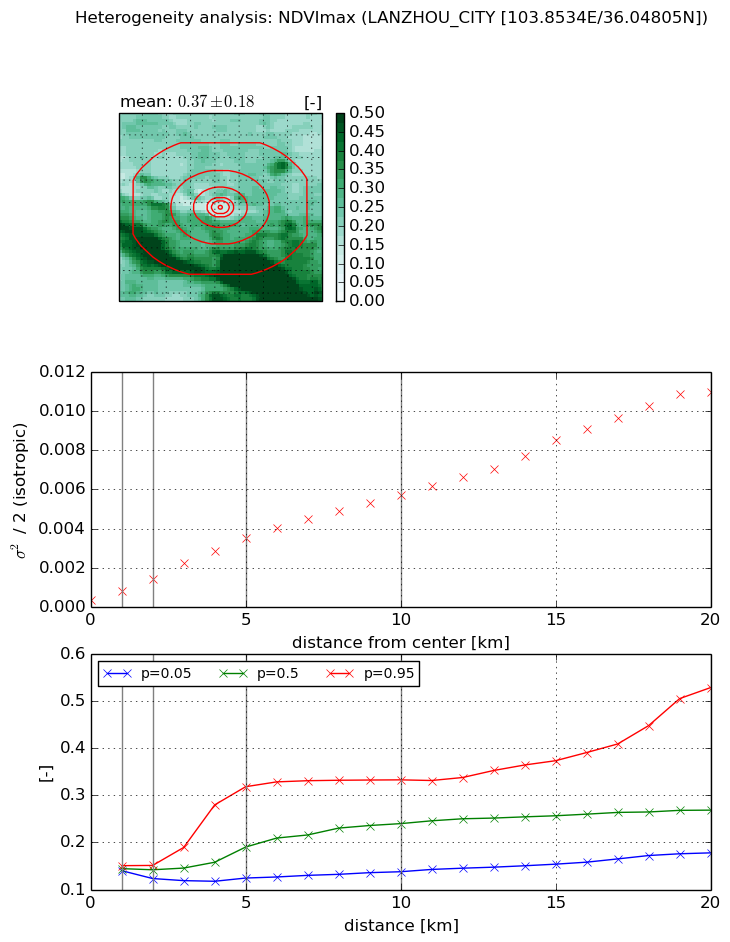
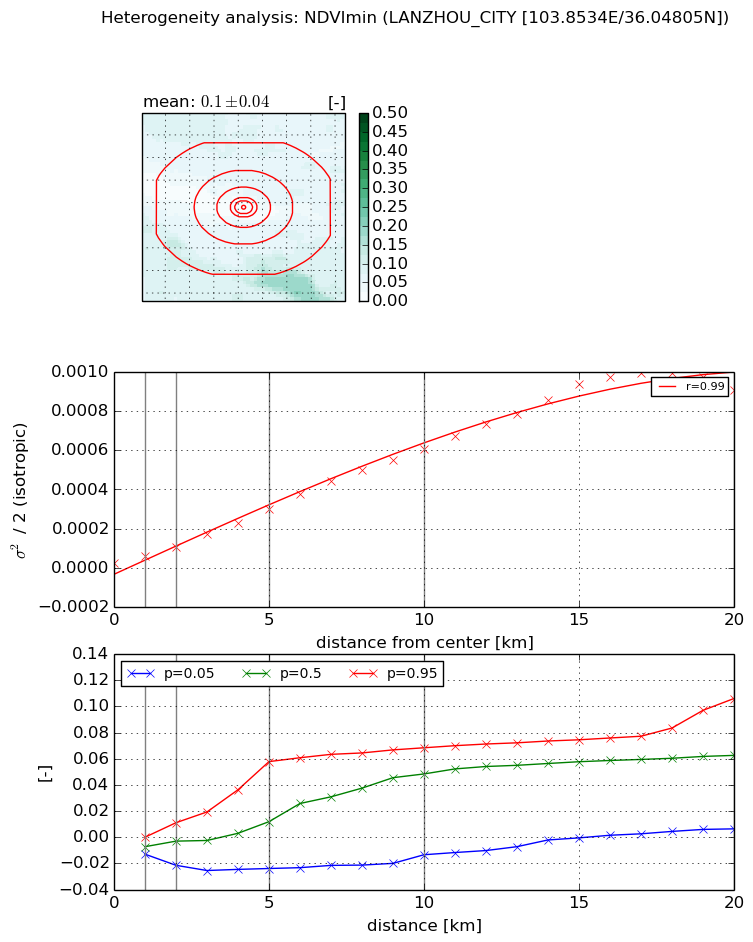
Heterogeneity analysis

The heterogeneity analysis provides information about the spatial and temporal heterogeneity of the site.

Topography


Roman et al. (2009) index


St

4.88675118018e-06

Rcv

0.963583981329

Rse

0.0

Rst

0.00886206247882

Rsv

613903.826343


Height range @ 1km [m]

8

Height range @ 2km [m]

16

Height range @ 5km [m]

471

Height range @ 10km [m]

-999

Height range @ 20km [m]

-999


Variance slope @ 1 km

5653

Variance slope @ 2 km

5705

Variance slope @ 5 km

4928

Variance slope @ 10 km

-999

Variance slope @ 20 km

-999


NDVI (max. NDVI composite)


Roman et al. (2009) index


St

3.48300236301e-09

Rcv

1.0906739486

Rse

0.0

Rst

0.277157758848

Rsv

861325856.994


NDVI range @ 1km [-]

0.01

NDVI range @ 2km [-]

0.03

NDVI range @ 5km [-]

0.19

NDVI range @ 10km [-]

0.2

NDVI range @ 20km [-]

0.35


Variance slope @ 1 km

0.000445764460226

Variance slope @ 2 km

0.000524778530561

Variance slope @ 5 km

0.000648433335413

Variance slope @ 10 km

0.000553380789041

Variance slope @ 20 km

0.000530164052111


NDVI (min. NDVI composite)I


Roman et al. (2009) index


St

1.75144571458

Rcv

-1.49151040618

Rse

0.0

Rst

-0.0541336424012

Rsv

-0.167226624501


NDVI range @ 1km [-]

0.01

NDVI range @ 2km [-]

0.03

NDVI range @ 5km [-]

0.08

NDVI range @ 10km [-]

0.08

NDVI range @ 20km [-]

0.1


NDVI slope @ 1 km

3.15749727827e-05

NDVI slope @ 2 km

3.9017296589e-05

NDVI slope @ 5 km

5.59786757227e-05

NDVI slope @ 10 km

6.1151144659e-05

NDVI slope @ 20 km

5.33454650409e-05


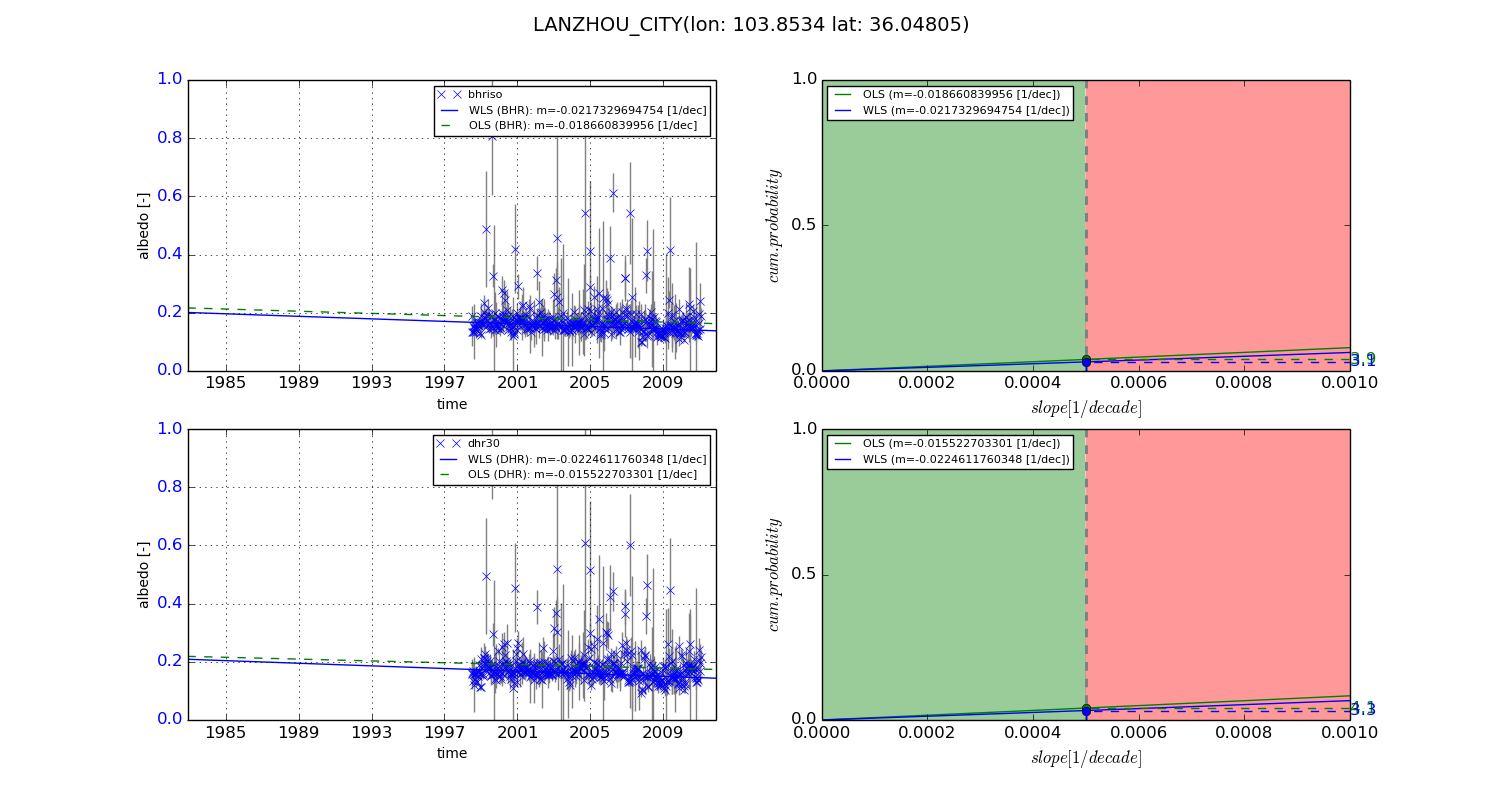
Temporal stability analysis

+000 deg (BHR)


BHR statistics

Temporal stability [1/decade]:


abs

rel


Weighted least square:

None


Ordinary least square:

None


Probabilities that GCOS criteria is met:

Weighted least square:

None %

Ordinary least square:

None %


DHR statistics

Temporal stability [1/decade]:


abs

rel


Weighted least square:

None


Ordinary least square:

None


Probabilities that GCOS criteria is met:

Weighted least square:

None %

Ordinary least square:

None %


+057/+063 deg (BHR)


BHR statistics

Temporal stability [1/decade]:


abs

rel


Weighted least square:

-0.0217329694754


Ordinary least square:

-0.018660839956


Probabilities that GCOS criteria is met:

Weighted least square:

3.1 %

Ordinary least square:

3.9 %


DHR statistics

Temporal stability [1/decade]:


abs

rel


Weighted least square:

-0.0224611760348


Ordinary least square:

-0.015522703301


Probabilities that GCOS criteria is met:

Weighted least square:

3.3 %

Ordinary least square:

4.1 %


Temporal anomaly analyis

The variance of the temporal anomalies provides an additional measure about the stability of the signal AFTER removal of the mean seasonal cylce.

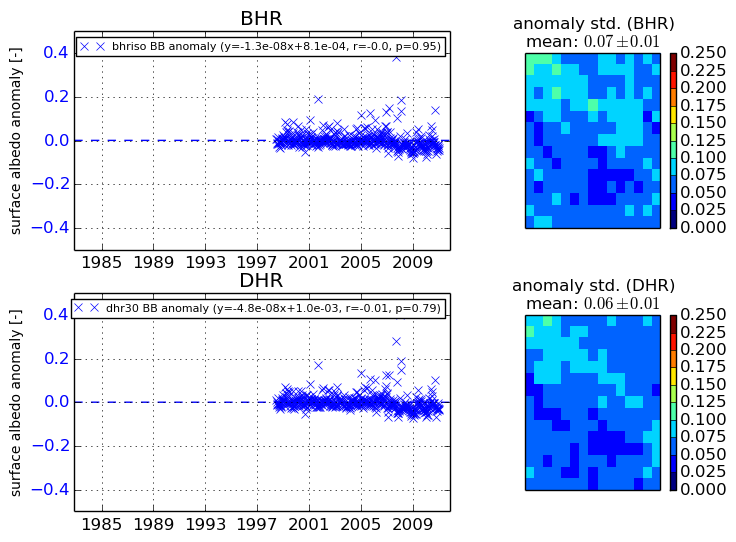
+000 deg


+057/+063 deg