LA_PAZ


Location

lon / lat [deg]: -68.0665 / -16.539

Source network: AERONET


Geostationary surface albedo (GSA) data


“+000”


“+057/+063”


Landcover information (based on ESA CCI landcover data)


Landcover fractions @ 2km distance


Landcover fractions @ 20 km distance


Legend


Distance to open water bodies [km]:

4.58

Distance to urban areas [km]:

0.19


Radius: 1 km

Number of landcover classes:

1

Dominant landcover type:

190: urban areas

Fraction of dominant landcover type [%]:

100.0


Radius: 2 km

Number of landcover classes:

1

Dominant landcover type:

190: urban areas

Fraction of dominant landcover type [%]:

100.0


Radius: 5 km

Number of landcover classes:

4

Dominant landcover type:

190: urban areas

Fraction of dominant landcover type [%]:

71.0


Radius: 10 km

Number of landcover classes:

5

Dominant landcover type:

190: urban areas

Fraction of dominant landcover type [%]:

40.0


Radius: 20 km

Number of landcover classes:

7

Dominant landcover type:

120: Shrubland

Fraction of dominant landcover type [%]:

26.0


Disturbances


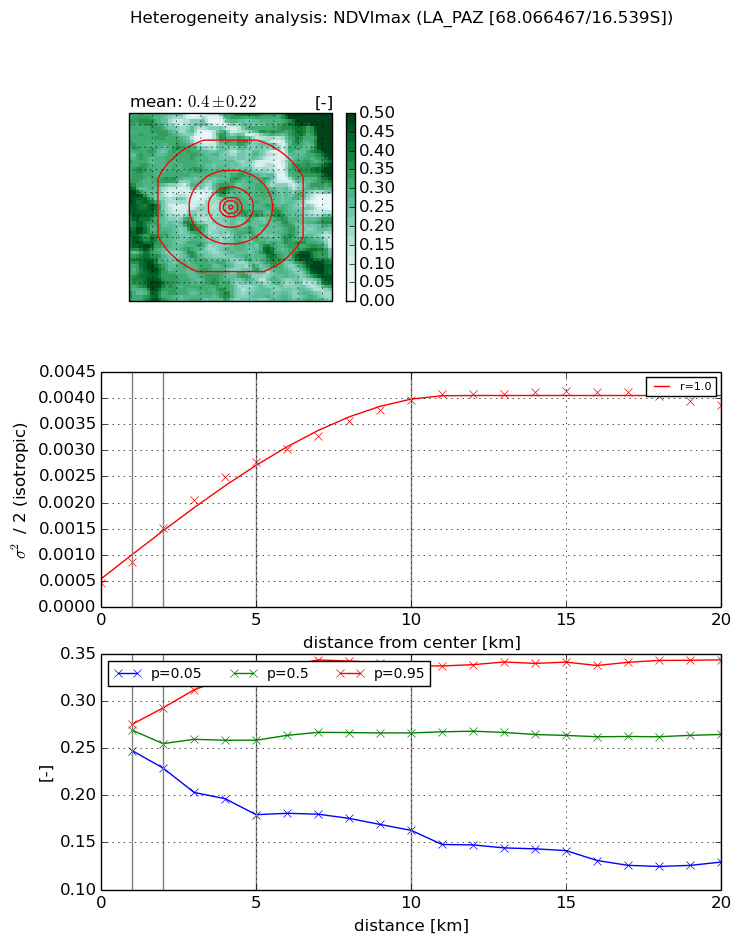
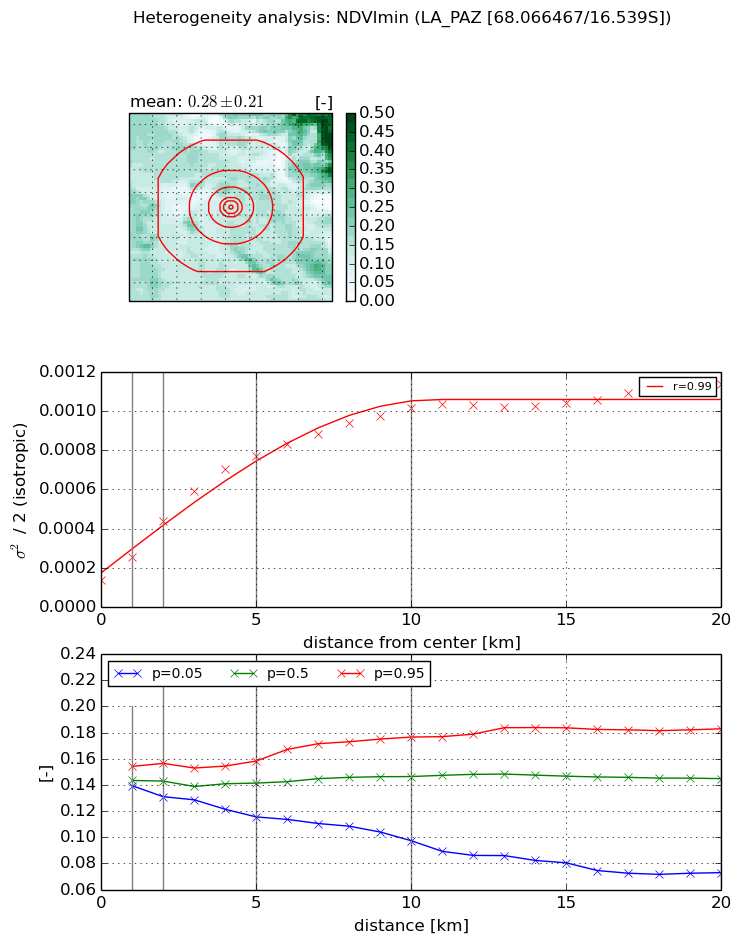
Heterogeneity analysis

The heterogeneity analysis provides information about the spatial and temporal heterogeneity of the site.

Topography


Roman et al. (2009) index


St

1.06551278222

Rcv

0.480780215123

Rse

0.0

Rst

3.99839385729e-08

Rsv

2.33476550845


Height range @ 1km [m]

159

Height range @ 2km [m]

309

Height range @ 5km [m]

682

Height range @ 10km [m]

-999

Height range @ 20km [m]

-999


Variance slope @ 1 km

9972

Variance slope @ 2 km

11336

Variance slope @ 5 km

10375

Variance slope @ 10 km

-999

Variance slope @ 20 km

-999


NDVI (max. NDVI composite)


Roman et al. (2009) index


St

2.38268661483e-07

Rcv

0.343607454337

Rse

0.0

Rst

0.0570933042054

Rsv

12590828.7135


NDVI range @ 1km [-]

0.03

NDVI range @ 2km [-]

0.06

NDVI range @ 5km [-]

0.15

NDVI range @ 10km [-]

0.17

NDVI range @ 20km [-]

0.21


Variance slope @ 1 km

0.00040419037085

Variance slope @ 2 km

0.000522015217229

Variance slope @ 5 km

0.000482431339888

Variance slope @ 10 km

0.00034691831517

Variance slope @ 20 km

0.000157280727374


NDVI (min. NDVI composite)I


Roman et al. (2009) index


St

1.37133847872

Rcv

0.71679279211

Rse

0.0

Rst

-0.470851169071

Rsv

-0.999999750826


NDVI range @ 1km [-]

0.01

NDVI range @ 2km [-]

0.03

NDVI range @ 5km [-]

0.04

NDVI range @ 10km [-]

0.08

NDVI range @ 20km [-]

0.11


NDVI slope @ 1 km

0.000118822339539

NDVI slope @ 2 km

0.000152021620405

NDVI slope @ 5 km

0.000133358135109

NDVI slope @ 10 km

8.61842952877e-05

NDVI slope @ 20 km

4.0934742046e-05


Temporal stability analysis

+000 deg (BHR)


BHR statistics

Temporal stability [1/decade]:


abs

rel


Weighted least square:

-99999.0


Ordinary least square:

-99999.0


Probabilities that GCOS criteria is met:

Weighted least square:

-99999.0 %

Ordinary least square:

-99999.0 %


DHR statistics

Temporal stability [1/decade]:


abs

rel


Weighted least square:

-99999.0


Ordinary least square:

-99999.0


Probabilities that GCOS criteria is met:

Weighted least square:

-99999.0 %

Ordinary least square:

-99999.0 %


+057/+063 deg (BHR)


BHR statistics

Temporal stability [1/decade]:


abs

rel


Weighted least square:

None


Ordinary least square:

None


Probabilities that GCOS criteria is met:

Weighted least square:

None %

Ordinary least square:

None %


DHR statistics

Temporal stability [1/decade]:


abs

rel


Weighted least square:

None


Ordinary least square:

None


Probabilities that GCOS criteria is met:

Weighted least square:

None %

Ordinary least square:

None %


Temporal anomaly analyis

The variance of the temporal anomalies provides an additional measure about the stability of the signal AFTER removal of the mean seasonal cylce.

+000 deg


+057/+063 deg