LINDENBERG


Location

lon / lat [deg]: 14.12 / 52.17

Source network: EOS_LAND


Geostationary surface albedo (GSA) data


“+000”


“+057/+063”


Landcover information (based on ESA CCI landcover data)


Landcover fractions @ 2km distance


Landcover fractions @ 20 km distance


Legend


Distance to open water bodies [km]:

3.01

Distance to urban areas [km]:

2.55


Radius: 1 km

Number of landcover classes:

1

Dominant landcover type:

10: cropland, rainfed

Fraction of dominant landcover type [%]:

100.0


Radius: 2 km

Number of landcover classes:

2

Dominant landcover type:

10: cropland, rainfed

Fraction of dominant landcover type [%]:

94.0


Radius: 5 km

Number of landcover classes:

4

Dominant landcover type:

10: cropland, rainfed

Fraction of dominant landcover type [%]:

80.0


Radius: 10 km

Number of landcover classes:

7

Dominant landcover type:

10: cropland, rainfed

Fraction of dominant landcover type [%]:

56.0


Radius: 20 km

Number of landcover classes:

9

Dominant landcover type:

70: Tree cover, needleleaved, evergreen, closed to open (>15%)

Fraction of dominant landcover type [%]:

41.0


Disturbances


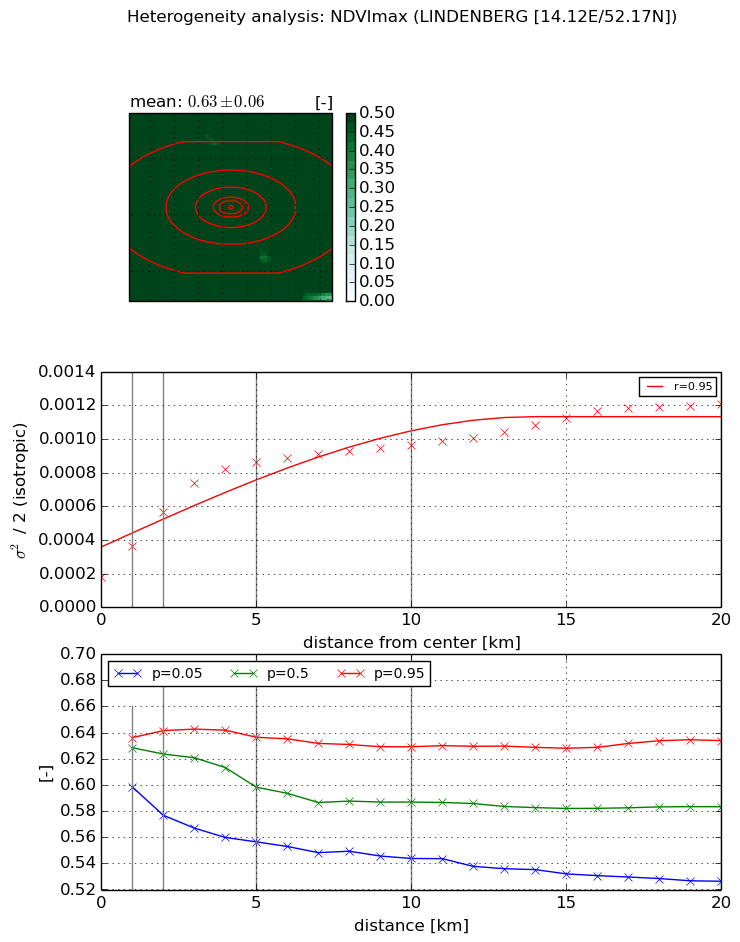
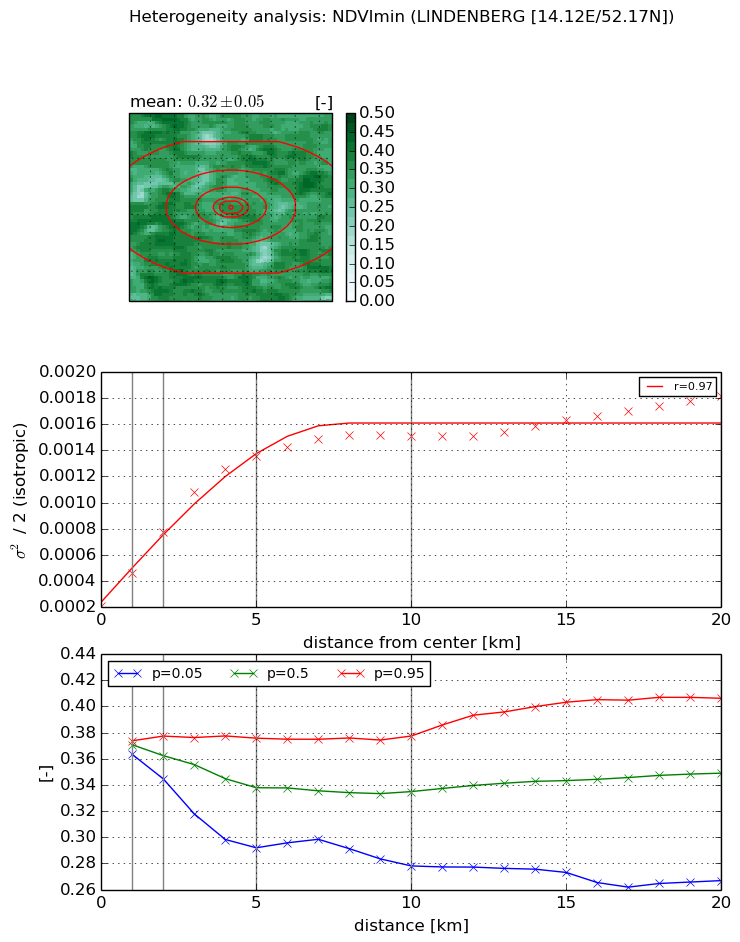
Heterogeneity analysis

The heterogeneity analysis provides information about the spatial and temporal heterogeneity of the site.

Topography


Roman et al. (2009) index


St

3.5424031446

Rcv

0.50890478864

Rse

0.0

Rst

-1.65588216907e-05

Rsv

-0.337961369594


Height range @ 1km [m]

15

Height range @ 2km [m]

23

Height range @ 5km [m]

44

Height range @ 10km [m]

-999

Height range @ 20km [m]

-999


Variance slope @ 1 km

32

Variance slope @ 2 km

30

Variance slope @ 5 km

35

Variance slope @ 10 km

-999

Variance slope @ 20 km

-999


NDVI (max. NDVI composite)


Roman et al. (2009) index


St

5.76350949558

Rcv

0.280928673188

Rse

0.0

Rst

0.148281055209

Rsv

0.0913064609657


NDVI range @ 1km [-]

0.04

NDVI range @ 2km [-]

0.06

NDVI range @ 5km [-]

0.08

NDVI range @ 10km [-]

0.09

NDVI range @ 20km [-]

0.11


Variance slope @ 1 km

0.000183875315671

Variance slope @ 2 km

0.000195351432831

Variance slope @ 5 km

0.000142358377879

Variance slope @ 10 km

7.05071843935e-05

Variance slope @ 20 km

3.98428190314e-05


NDVI (min. NDVI composite)I


Roman et al. (2009) index


St

3.48432295419

Rcv

0.563075857099

Rse

0.0

Rst

-0.0527919888451

Rsv

0.245131561817


NDVI range @ 1km [-]

0.01

NDVI range @ 2km [-]

0.03

NDVI range @ 5km [-]

0.08

NDVI range @ 10km [-]

0.1

NDVI range @ 20km [-]

0.14


NDVI slope @ 1 km

0.000257100962788

NDVI slope @ 2 km

0.000284806793074

NDVI slope @ 5 km

0.000240080849706

NDVI slope @ 10 km

0.00012659212723

NDVI slope @ 20 km

5.77662863046e-05


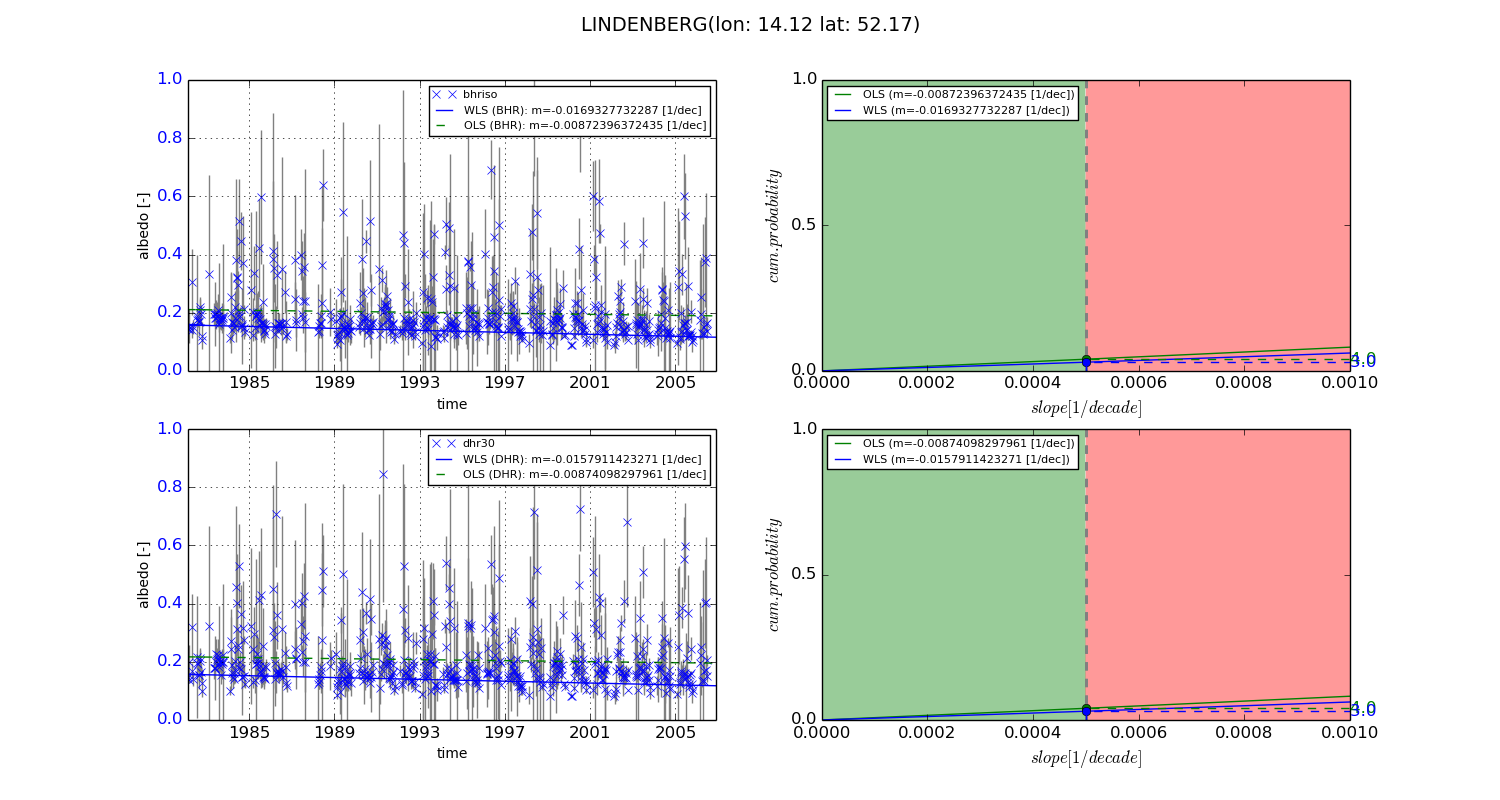
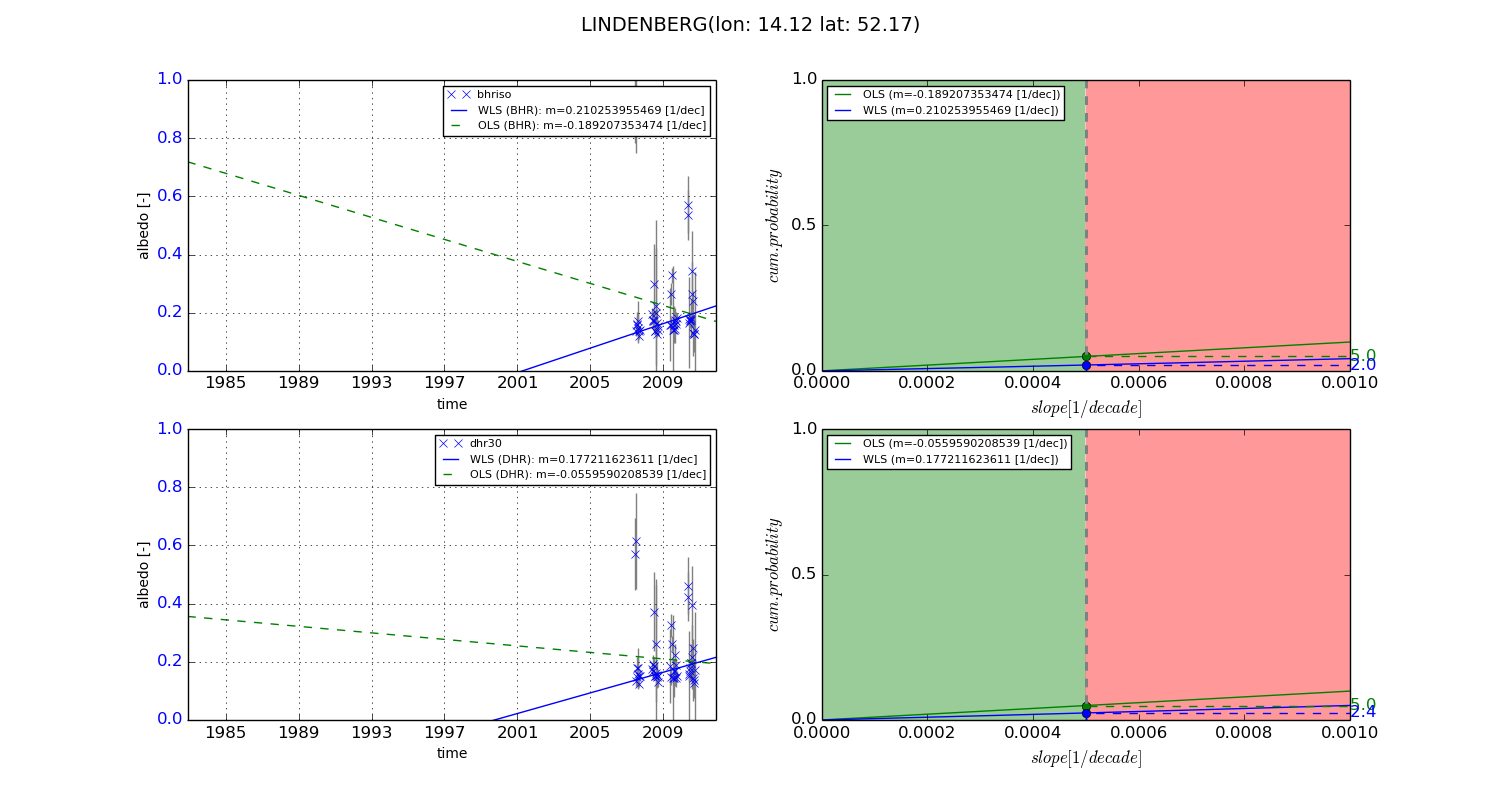
Temporal stability analysis

+000 deg (BHR)


BHR statistics

Temporal stability [1/decade]:


abs

rel


Weighted least square:

-0.0169327732287


Ordinary least square:

-0.00872396372435


Probabilities that GCOS criteria is met:

Weighted least square:

3.0 %

Ordinary least square:

4.0 %


DHR statistics

Temporal stability [1/decade]:


abs

rel


Weighted least square:

-0.0157911423271


Ordinary least square:

-0.00874098297961


Probabilities that GCOS criteria is met:

Weighted least square:

3.0 %

Ordinary least square:

4.0 %


+057/+063 deg (BHR)


BHR statistics

Temporal stability [1/decade]:


abs

rel


Weighted least square:

0.210253955469


Ordinary least square:

-0.189207353474


Probabilities that GCOS criteria is met:

Weighted least square:

2.0 %

Ordinary least square:

5.0 %


DHR statistics

Temporal stability [1/decade]:


abs

rel


Weighted least square:

0.177211623611


Ordinary least square:

-0.0559590208539


Probabilities that GCOS criteria is met:

Weighted least square:

2.4 %

Ordinary least square:

5.0 %


Temporal anomaly analyis

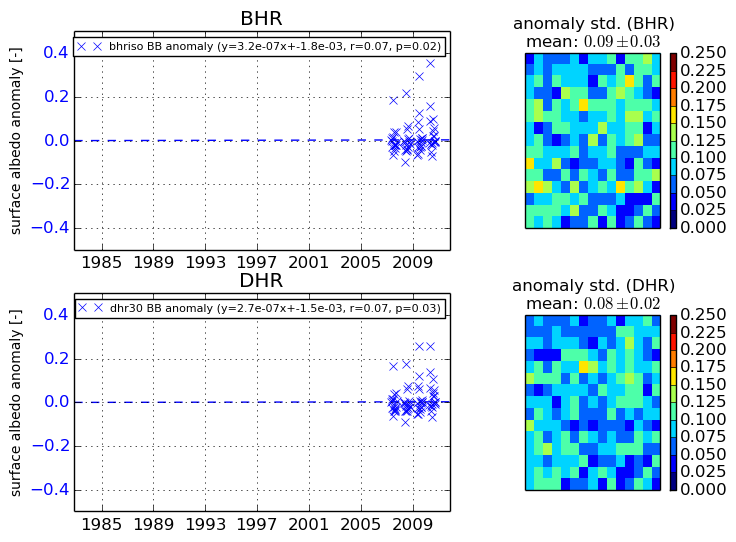
The variance of the temporal anomalies provides an additional measure about the stability of the signal AFTER removal of the mean seasonal cylce.
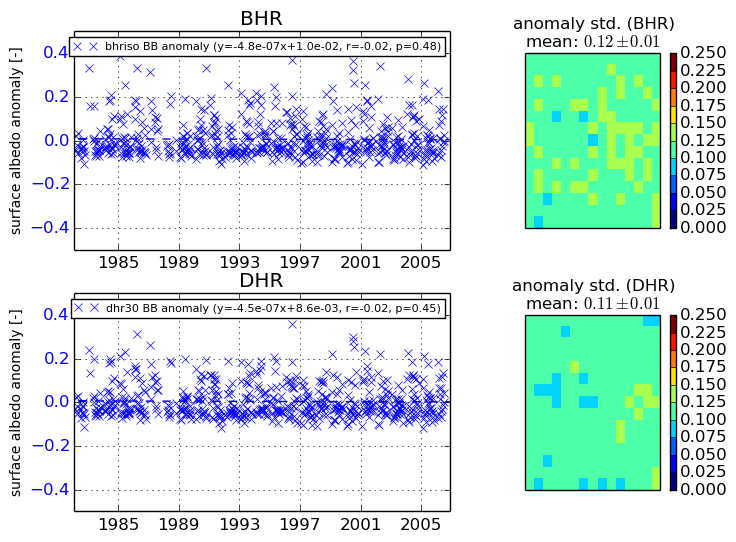
+000 deg


+057/+063 deg