LOS_FIEROS


Location

lon / lat [deg]: -60.6167 / -14.55

Source network: AERONET


Geostationary surface albedo (GSA) data


“+000”


“+057/+063”


Landcover information (based on ESA CCI landcover data)


Landcover fractions @ 2km distance


Landcover fractions @ 20 km distance


Legend


Distance to open water bodies [km]:

16.6

Distance to urban areas [km]:

32.86


Radius: 1 km

Number of landcover classes:

2

Dominant landcover type:

50: Tree cover, broadleaved, evergreen, closed to open (>15%)

Fraction of dominant landcover type [%]:

81.0


Radius: 2 km

Number of landcover classes:

2

Dominant landcover type:

50: Tree cover, broadleaved, evergreen, closed to open (>15%)

Fraction of dominant landcover type [%]:

83.0


Radius: 5 km

Number of landcover classes:

2

Dominant landcover type:

50: Tree cover, broadleaved, evergreen, closed to open (>15%)

Fraction of dominant landcover type [%]:

77.0


Radius: 10 km

Number of landcover classes:

3

Dominant landcover type:

50: Tree cover, broadleaved, evergreen, closed to open (>15%)

Fraction of dominant landcover type [%]:

66.0


Radius: 20 km

Number of landcover classes:

3

Dominant landcover type:

50: Tree cover, broadleaved, evergreen, closed to open (>15%)

Fraction of dominant landcover type [%]:

69.0


Disturbances


Heterogeneity analysis

The heterogeneity analysis provides information about the spatial and temporal heterogeneity of the site.

Topography


Roman et al. (2009) index


St

1.35234132071e-13

Rcv

0.392529003444

Rse

0.0

Rst

7.18838370162e-07

Rsv

2.21837486888e+13


Height range @ 1km [m]

28

Height range @ 2km [m]

54

Height range @ 5km [m]

101

Height range @ 10km [m]

-999

Height range @ 20km [m]

-999


Variance slope @ 1 km

56

Variance slope @ 2 km

109

Variance slope @ 5 km

238

Variance slope @ 10 km

-999

Variance slope @ 20 km

-999


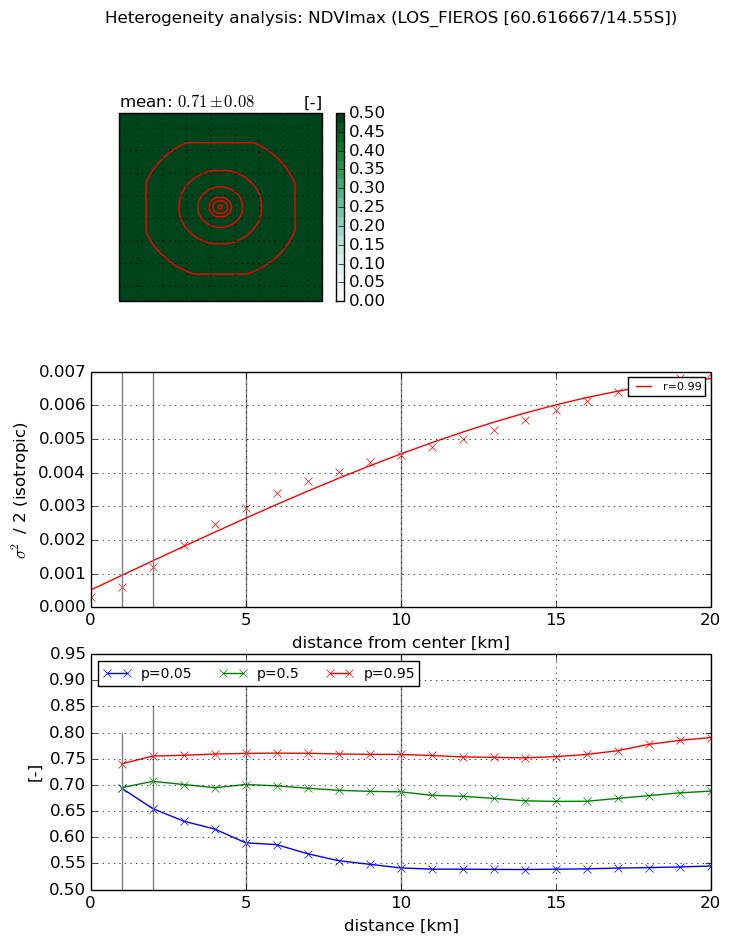
NDVI (max. NDVI composite)


Roman et al. (2009) index


St

1.54219408082

Rcv

0.184924065031

Rse

0.0

Rst

0.0110165922849

Rsv

1.74933979558


NDVI range @ 1km [-]

0.05

NDVI range @ 2km [-]

0.1

NDVI range @ 5km [-]

0.17

NDVI range @ 10km [-]

0.22

NDVI range @ 20km [-]

0.25


Variance slope @ 1 km

0.000302381520571

Variance slope @ 2 km

0.000436854727346

Variance slope @ 5 km

0.000557294565578

Variance slope @ 10 km

0.000447115681993

Variance slope @ 20 km

0.000324833620049


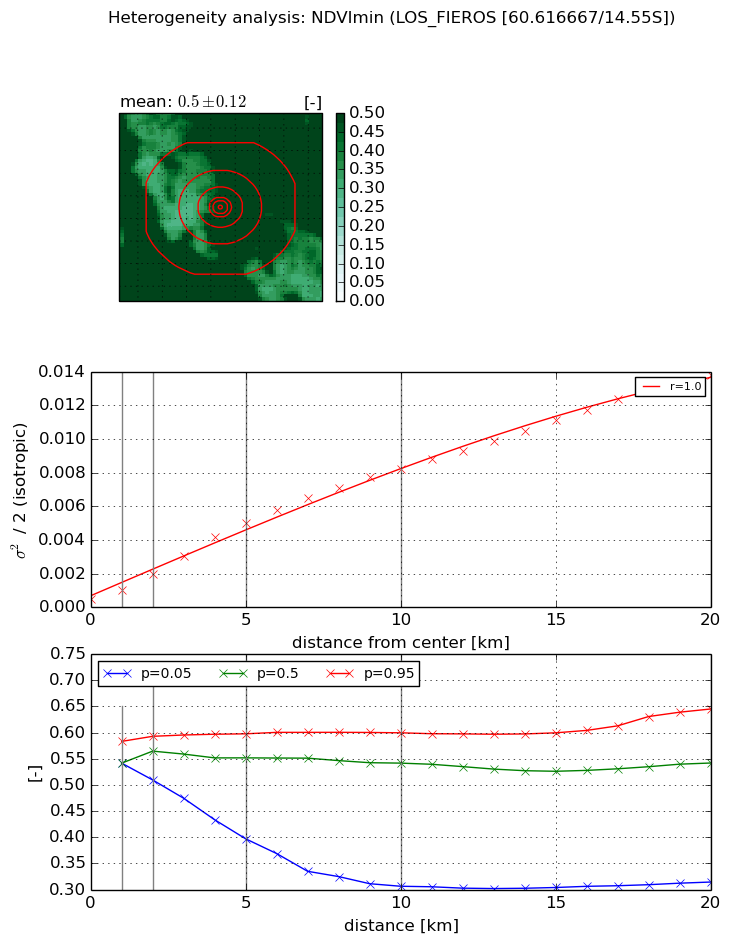
NDVI (min. NDVI composite)I


Roman et al. (2009) index


St

1.54474816805

Rcv

0.552312093783

Rse

0.0

Rst

-3.4095680761e-10

Rsv

1.38975203131


NDVI range @ 1km [-]

0.04

NDVI range @ 2km [-]

0.08

NDVI range @ 5km [-]

0.2

NDVI range @ 10km [-]

0.29

NDVI range @ 20km [-]

0.33


NDVI slope @ 1 km

0.000492664086093

NDVI slope @ 2 km

0.000718477690304

NDVI slope @ 5 km

0.000942418061466

NDVI slope @ 10 km

0.000811137593864

NDVI slope @ 20 km

0.000661827195842


Temporal stability analysis

+000 deg (BHR)


BHR statistics

Temporal stability [1/decade]:


abs

rel


Weighted least square:

-99999.0


Ordinary least square:

-99999.0


Probabilities that GCOS criteria is met:

Weighted least square:

-99999.0 %

Ordinary least square:

-99999.0 %


DHR statistics

Temporal stability [1/decade]:


abs

rel


Weighted least square:

-99999.0


Ordinary least square:

-99999.0


Probabilities that GCOS criteria is met:

Weighted least square:

-99999.0 %

Ordinary least square:

-99999.0 %


+057/+063 deg (BHR)


BHR statistics

Temporal stability [1/decade]:


abs

rel


Weighted least square:

None


Ordinary least square:

None


Probabilities that GCOS criteria is met:

Weighted least square:

None %

Ordinary least square:

None %


DHR statistics

Temporal stability [1/decade]:


abs

rel


Weighted least square:

None


Ordinary least square:

None


Probabilities that GCOS criteria is met:

Weighted least square:

None %

Ordinary least square:

None %


Temporal anomaly analyis

The variance of the temporal anomalies provides an additional measure about the stability of the signal AFTER removal of the mean seasonal cylce.

+000 deg


+057/+063 deg