LSU


Location

lon / lat [deg]: -91.1839 / 30.4068

Source network: AERONET


Geostationary surface albedo (GSA) data


“+000”


“+057/+063”


Landcover information (based on ESA CCI landcover data)


Landcover fractions @ 2km distance


Landcover fractions @ 20 km distance


Legend


Distance to open water bodies [km]:

1.55

Distance to urban areas [km]:

0.08


Radius: 1 km

Number of landcover classes:

2

Dominant landcover type:

190: urban areas

Fraction of dominant landcover type [%]:

74.0


Radius: 2 km

Number of landcover classes:

4

Dominant landcover type:

190: urban areas

Fraction of dominant landcover type [%]:

65.0


Radius: 5 km

Number of landcover classes:

9

Dominant landcover type:

190: urban areas

Fraction of dominant landcover type [%]:

49.0


Radius: 10 km

Number of landcover classes:

9

Dominant landcover type:

190: urban areas

Fraction of dominant landcover type [%]:

46.0


Radius: 20 km

Number of landcover classes:

8

Dominant landcover type:

190: urban areas

Fraction of dominant landcover type [%]:

30.0


Disturbances


Heterogeneity analysis

The heterogeneity analysis provides information about the spatial and temporal heterogeneity of the site.

Topography


Roman et al. (2009) index


St

4.67527979791

Rcv

-0.122120783987

Rse

0.0

Rst

0.0729870253119

Rsv

-0.446565016645


Height range @ 1km [m]

13

Height range @ 2km [m]

13

Height range @ 5km [m]

18

Height range @ 10km [m]

-999

Height range @ 20km [m]

-999


Variance slope @ 1 km

20

Variance slope @ 2 km

12

Variance slope @ 5 km

5

Variance slope @ 10 km

-999

Variance slope @ 20 km

-999


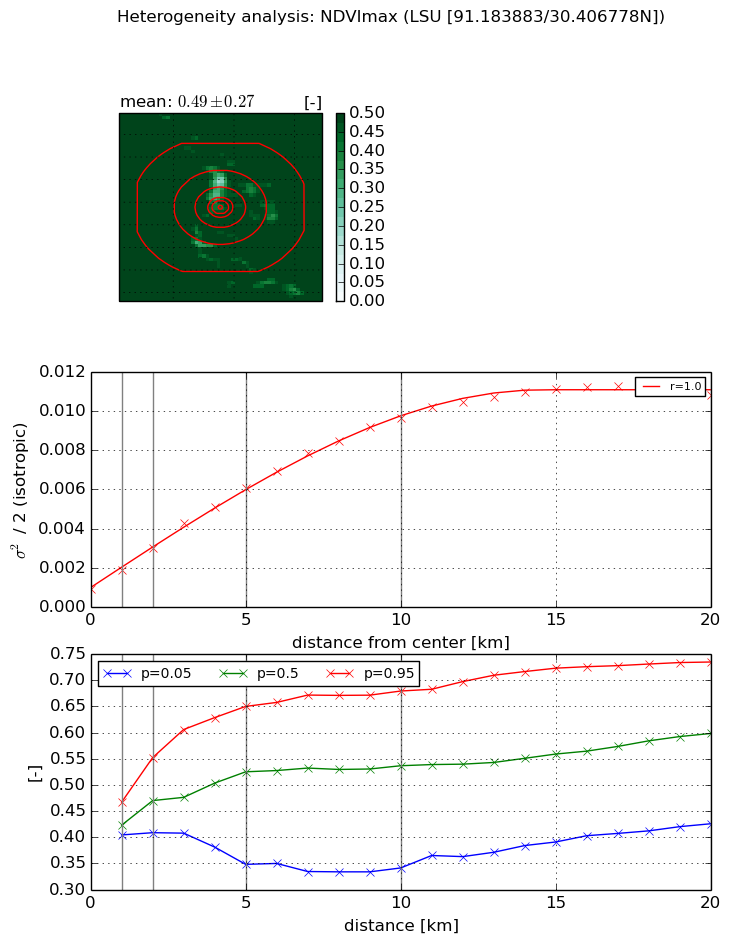
NDVI (max. NDVI composite)


Roman et al. (2009) index


St

0.262093221048

Rcv

0.352877803046

Rse

0.0

Rst

1.62128794921e-07

Rsv

11.0934310542


NDVI range @ 1km [-]

0.06

NDVI range @ 2km [-]

0.14

NDVI range @ 5km [-]

0.3

NDVI range @ 10km [-]

0.34

NDVI range @ 20km [-]

0.31


Variance slope @ 1 km

0.00100837992974

Variance slope @ 2 km

0.00105145853964

Variance slope @ 5 km

0.0010449349553

Variance slope @ 10 km

0.000893564839009

Variance slope @ 20 km

0.000505609342316


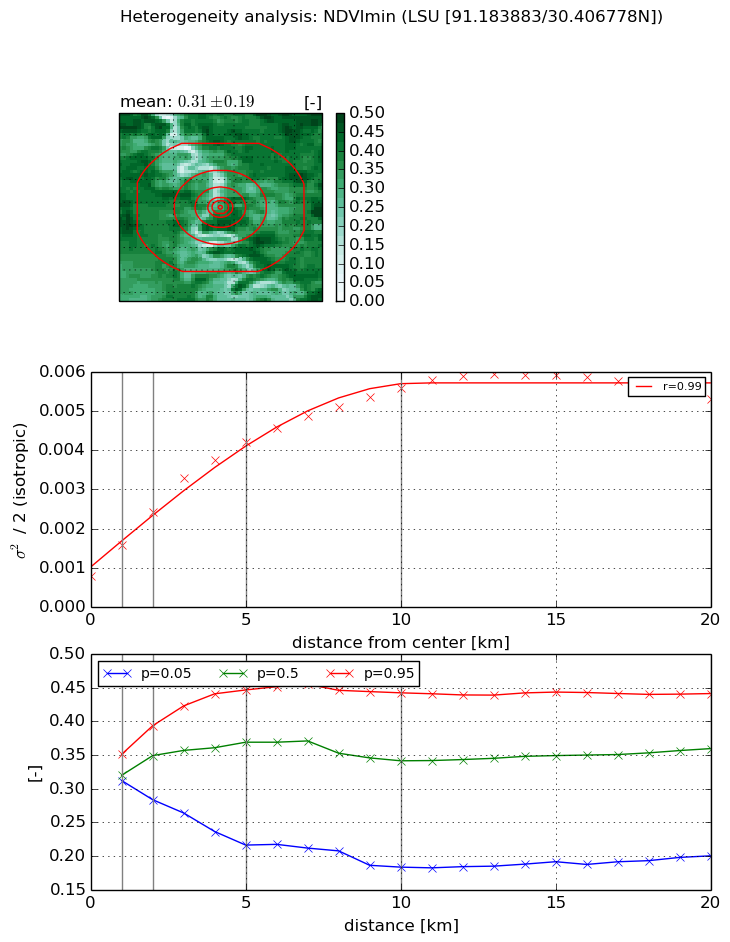
NDVI (min. NDVI composite)I


Roman et al. (2009) index


St

2.84270654272

Rcv

0.409438296812

Rse

0.0

Rst

-3.19922594632e-08

Rsv

-0.64589395925


NDVI range @ 1km [-]

0.04

NDVI range @ 2km [-]

0.11

NDVI range @ 5km [-]

0.23

NDVI range @ 10km [-]

0.26

NDVI range @ 20km [-]

0.24


NDVI slope @ 1 km

0.00079392079946

NDVI slope @ 2 km

0.000816128718427

NDVI slope @ 5 km

0.000700554275329

NDVI slope @ 10 km

0.000464448354844

NDVI slope @ 20 km

0.000201603905788


Temporal stability analysis

+000 deg (BHR)


BHR statistics

Temporal stability [1/decade]:


abs

rel


Weighted least square:

None


Ordinary least square:

None


Probabilities that GCOS criteria is met:

Weighted least square:

None %

Ordinary least square:

None %


DHR statistics

Temporal stability [1/decade]:


abs

rel


Weighted least square:

None


Ordinary least square:

None


Probabilities that GCOS criteria is met:

Weighted least square:

None %

Ordinary least square:

None %


+057/+063 deg (BHR)


BHR statistics

Temporal stability [1/decade]:


abs

rel


Weighted least square:

None


Ordinary least square:

None


Probabilities that GCOS criteria is met:

Weighted least square:

None %

Ordinary least square:

None %


DHR statistics

Temporal stability [1/decade]:


abs

rel


Weighted least square:

None


Ordinary least square:

None


Probabilities that GCOS criteria is met:

Weighted least square:

None %

Ordinary least square:

None %


Temporal anomaly analyis

The variance of the temporal anomalies provides an additional measure about the stability of the signal AFTER removal of the mean seasonal cylce.

+000 deg


+057/+063 deg