LTER_NETWORK_OFFICE_LNO


Location

lon / lat [deg]: -106.62 / 35.08

Source network: LTER


Geostationary surface albedo (GSA) data


“+000”


“+057/+063”


Landcover information (based on ESA CCI landcover data)


Landcover fractions @ 2km distance


Landcover fractions @ 20 km distance


Legend


Distance to open water bodies [km]:

3.86

Distance to urban areas [km]:

0.12


Radius: 1 km

Number of landcover classes:

1

Dominant landcover type:

190: urban areas

Fraction of dominant landcover type [%]:

100.0


Radius: 2 km

Number of landcover classes:

1

Dominant landcover type:

190: urban areas

Fraction of dominant landcover type [%]:

100.0


Radius: 5 km

Number of landcover classes:

2

Dominant landcover type:

190: urban areas

Fraction of dominant landcover type [%]:

97.0


Radius: 10 km

Number of landcover classes:

3

Dominant landcover type:

190: urban areas

Fraction of dominant landcover type [%]:

82.0


Radius: 20 km

Number of landcover classes:

5

Dominant landcover type:

190: urban areas

Fraction of dominant landcover type [%]:

37.0


Disturbances


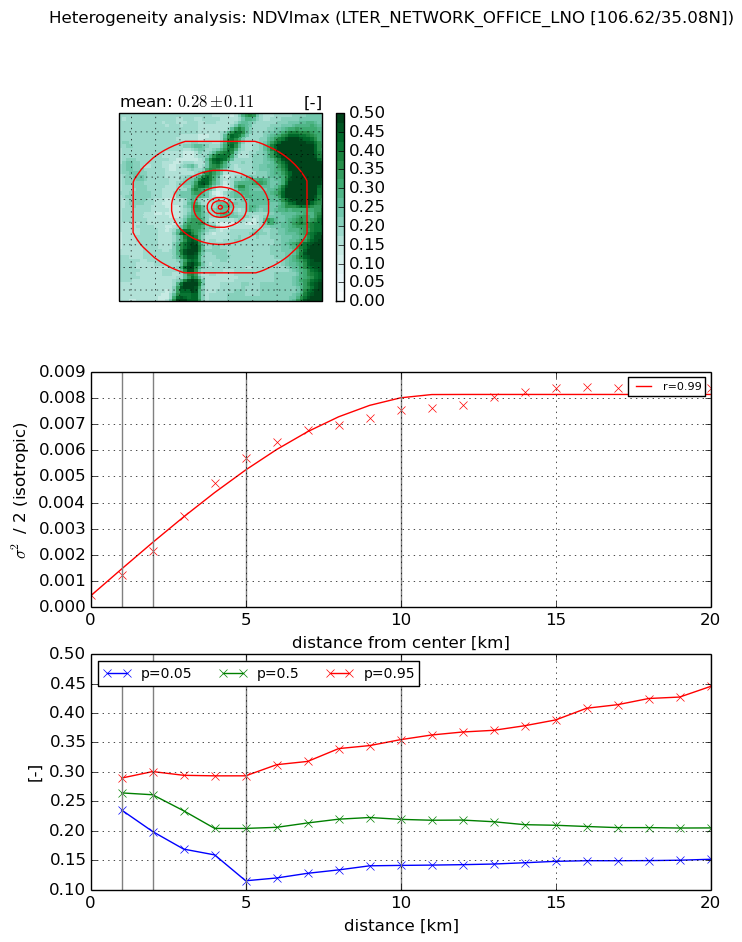
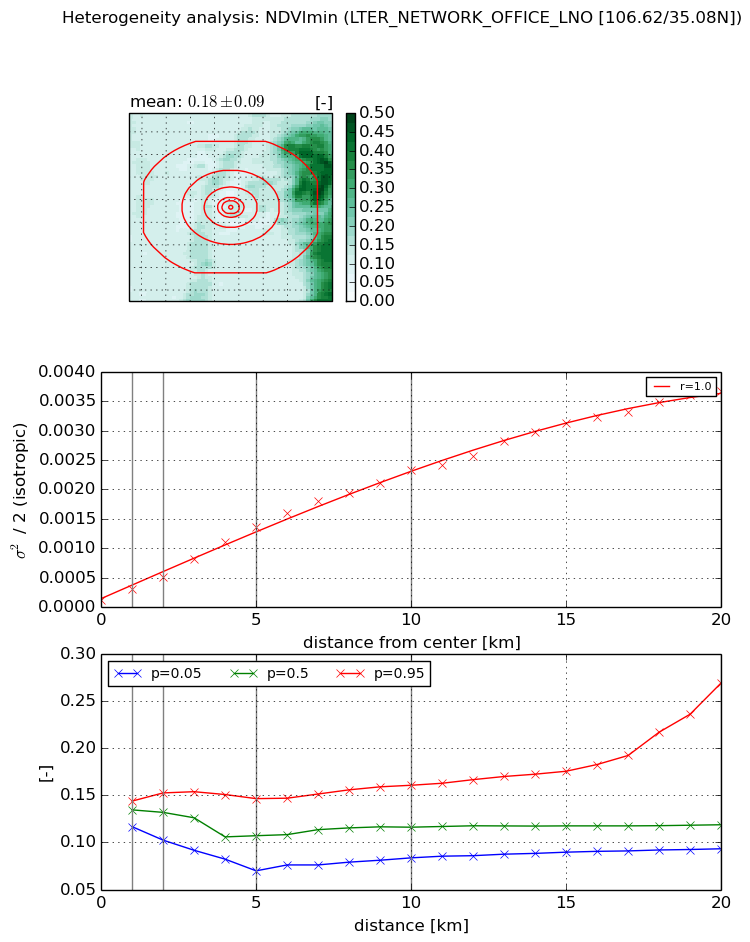
Heterogeneity analysis

The heterogeneity analysis provides information about the spatial and temporal heterogeneity of the site.

Topography


Roman et al. (2009) index


St

0.295274463144

Rcv

0.336606651705

Rse

0.0

Rst

1.11123871436e-06

Rsv

9.82343102964


Height range @ 1km [m]

21

Height range @ 2km [m]

74

Height range @ 5km [m]

121

Height range @ 10km [m]

-999

Height range @ 20km [m]

-999


Variance slope @ 1 km

112

Variance slope @ 2 km

188

Variance slope @ 5 km

369

Variance slope @ 10 km

-999

Variance slope @ 20 km

-999


NDVI (max. NDVI composite)


Roman et al. (2009) index


St

nan

Rcv

nan

Rse

nan

Rst

nan

Rsv

nan


NDVI range @ 1km [-]

0.05

NDVI range @ 2km [-]

0.1

NDVI range @ 5km [-]

0.18

NDVI range @ 10km [-]

0.21

NDVI range @ 20km [-]

0.29


Variance slope @ 1 km

0.000778531252317

Variance slope @ 2 km

0.000840502391595

Variance slope @ 5 km

0.00108406845

Variance slope @ 10 km

0.000745477046684

Variance slope @ 20 km

0.000358358552256


NDVI (min. NDVI composite)I


Roman et al. (2009) index


St

3.98404287568

Rcv

0.185646202291

Rse

0.0

Rst

0.234381188706

Rsv

-0.33297655339


NDVI range @ 1km [-]

0.03

NDVI range @ 2km [-]

0.05

NDVI range @ 5km [-]

0.08

NDVI range @ 10km [-]

0.08

NDVI range @ 20km [-]

0.18


NDVI slope @ 1 km

0.000184051996257

NDVI slope @ 2 km

0.0001977110859

NDVI slope @ 5 km

0.000255596822384

NDVI slope @ 10 km

0.000227017198341

NDVI slope @ 20 km

0.000179279387113


Temporal stability analysis

+000 deg (BHR)


BHR statistics

Temporal stability [1/decade]:


abs

rel


Weighted least square:

None


Ordinary least square:

None


Probabilities that GCOS criteria is met:

Weighted least square:

None %

Ordinary least square:

None %


DHR statistics

Temporal stability [1/decade]:


abs

rel


Weighted least square:

None


Ordinary least square:

None


Probabilities that GCOS criteria is met:

Weighted least square:

None %

Ordinary least square:

None %


+057/+063 deg (BHR)


BHR statistics

Temporal stability [1/decade]:


abs

rel


Weighted least square:

None


Ordinary least square:

None


Probabilities that GCOS criteria is met:

Weighted least square:

None %

Ordinary least square:

None %


DHR statistics

Temporal stability [1/decade]:


abs

rel


Weighted least square:

None


Ordinary least square:

None


Probabilities that GCOS criteria is met:

Weighted least square:

None %

Ordinary least square:

None %


Temporal anomaly analyis

The variance of the temporal anomalies provides an additional measure about the stability of the signal AFTER removal of the mean seasonal cylce.

+000 deg


+057/+063 deg