LUANG_NAMTHA


Location

lon / lat [deg]: 101.4162 / 20.9311

Source network: AERONET


Geostationary surface albedo (GSA) data


“+000”


“+057/+063”


Landcover information (based on ESA CCI landcover data)


Landcover fractions @ 2km distance


Landcover fractions @ 20 km distance


Legend


Distance to open water bodies [km]:

48.51

Distance to urban areas [km]:

6.68


Radius: 1 km

Number of landcover classes:

3

Dominant landcover type:

121: Shrubland

Fraction of dominant landcover type [%]:

49.0


Radius: 2 km

Number of landcover classes:

4

Dominant landcover type:

121: Shrubland

Fraction of dominant landcover type [%]:

48.0


Radius: 5 km

Number of landcover classes:

5

Dominant landcover type:

121: Shrubland

Fraction of dominant landcover type [%]:

46.0


Radius: 10 km

Number of landcover classes:

6

Dominant landcover type:

121: Shrubland

Fraction of dominant landcover type [%]:

41.0


Radius: 20 km

Number of landcover classes:

6

Dominant landcover type:

50: Tree cover, broadleaved, evergreen, closed to open (>15%)

Fraction of dominant landcover type [%]:

58.0


Disturbances


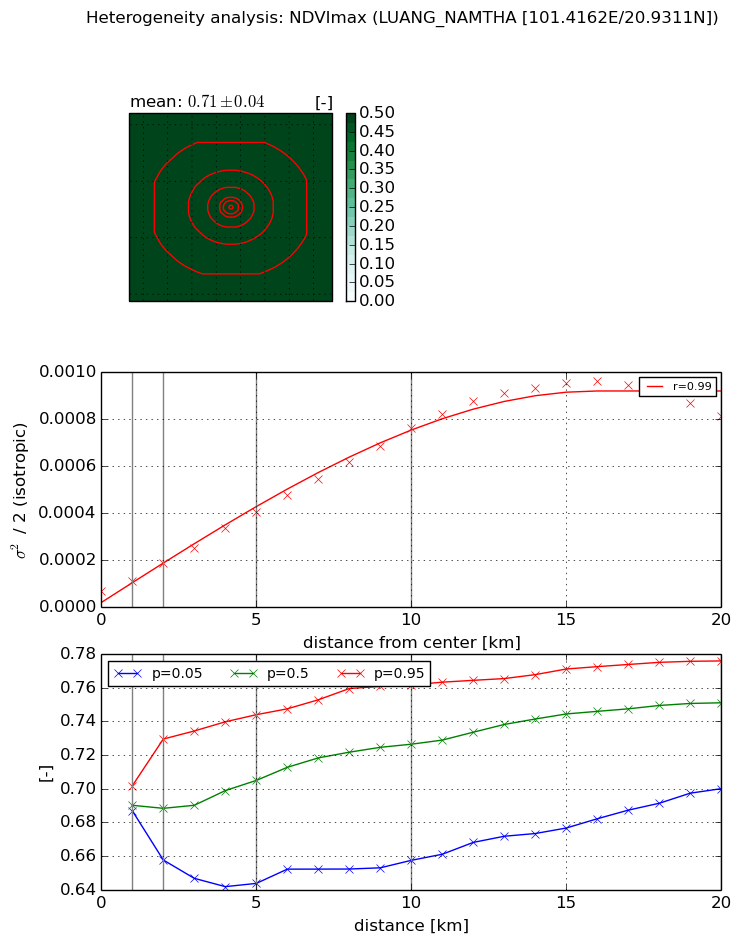
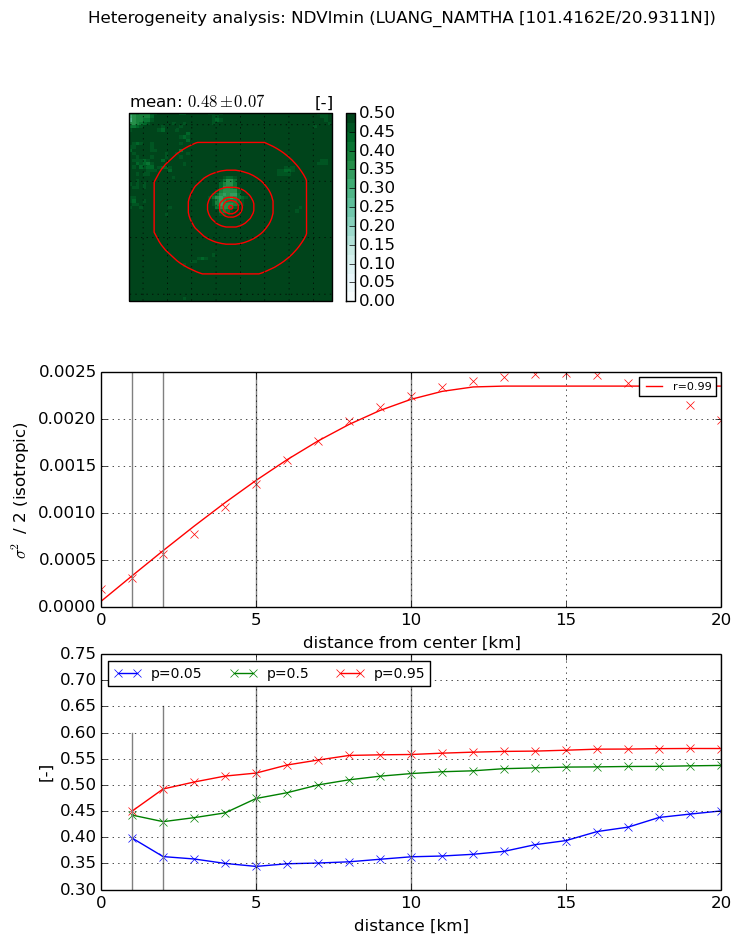
Heterogeneity analysis

The heterogeneity analysis provides information about the spatial and temporal heterogeneity of the site.

Topography


Roman et al. (2009) index


St

2.52591261524e-05

Rcv

0.418548810557

Rse

0.0

Rst

-0.0126528694337

Rsv

118768.523112


Height range @ 1km [m]

43

Height range @ 2km [m]

91

Height range @ 5km [m]

231

Height range @ 10km [m]

-999

Height range @ 20km [m]

-999


Variance slope @ 1 km

1926

Variance slope @ 2 km

1766

Variance slope @ 5 km

1431

Variance slope @ 10 km

-999

Variance slope @ 20 km

-999


NDVI (max. NDVI composite)


Roman et al. (2009) index


St

5.66778659894

Rcv

0.0713025360975

Rse

0.0

Rst

-0.0188758063874

Rsv

0.439128812545


NDVI range @ 1km [-]

0.01

NDVI range @ 2km [-]

0.07

NDVI range @ 5km [-]

0.1

NDVI range @ 10km [-]

0.1

NDVI range @ 20km [-]

0.08


Variance slope @ 1 km

4.08886642333e-05

Variance slope @ 2 km

5.99411759982e-05

Variance slope @ 5 km

6.86451884409e-05

Variance slope @ 10 km

7.0698488684e-05

Variance slope @ 20 km

4.54740506954e-05


NDVI (min. NDVI composite)I


Roman et al. (2009) index


St

4.23457460133

Rcv

0.152513448281

Rse

0.0

Rst

-0.101229998673

Rsv

0.4547102426


NDVI range @ 1km [-]

0.05

NDVI range @ 2km [-]

0.13

NDVI range @ 5km [-]

0.18

NDVI range @ 10km [-]

0.2

NDVI range @ 20km [-]

0.12


NDVI slope @ 1 km

0.000117199783848

NDVI slope @ 2 km

0.000184879701337

NDVI slope @ 5 km

0.000229643263891

NDVI slope @ 10 km

0.000220376283844

NDVI slope @ 20 km

0.000104540712563


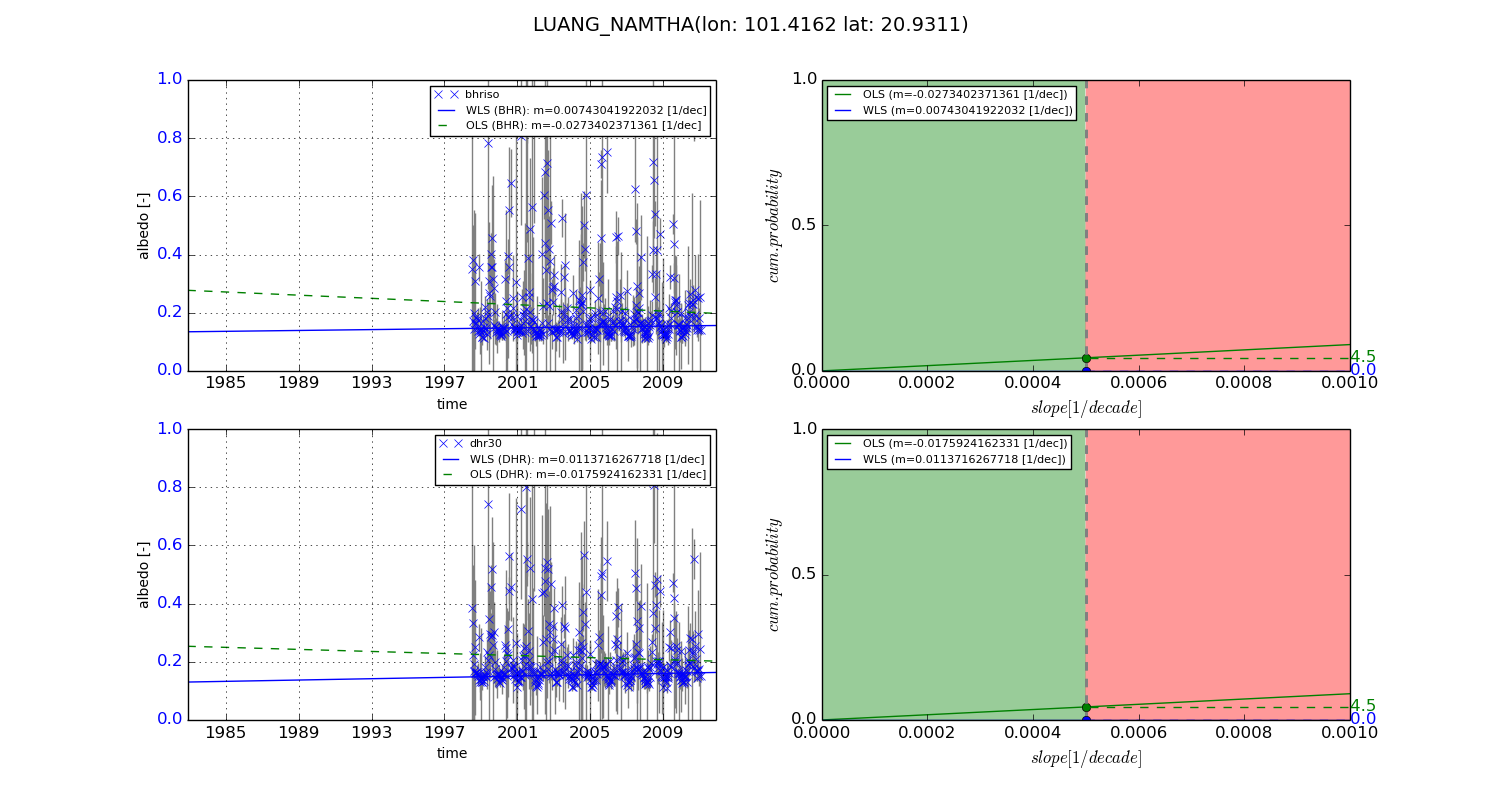
Temporal stability analysis

+000 deg (BHR)


BHR statistics

Temporal stability [1/decade]:


abs

rel


Weighted least square:

None


Ordinary least square:

None


Probabilities that GCOS criteria is met:

Weighted least square:

None %

Ordinary least square:

None %


DHR statistics

Temporal stability [1/decade]:


abs

rel


Weighted least square:

None


Ordinary least square:

None


Probabilities that GCOS criteria is met:

Weighted least square:

None %

Ordinary least square:

None %


+057/+063 deg (BHR)


BHR statistics

Temporal stability [1/decade]:


abs

rel


Weighted least square:

0.00743041922032


Ordinary least square:

-0.0273402371361


Probabilities that GCOS criteria is met:

Weighted least square:

0.0 %

Ordinary least square:

4.5 %


DHR statistics

Temporal stability [1/decade]:


abs

rel


Weighted least square:

0.0113716267718


Ordinary least square:

-0.0175924162331


Probabilities that GCOS criteria is met:

Weighted least square:

0.0 %

Ordinary least square:

4.5 %


Temporal anomaly analyis

The variance of the temporal anomalies provides an additional measure about the stability of the signal AFTER removal of the mean seasonal cylce.

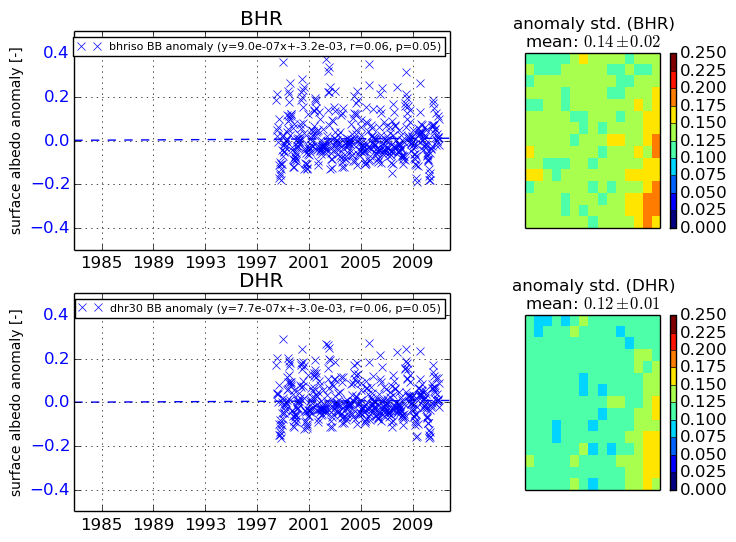
+000 deg


+057/+063 deg