LUMBINI


Location

lon / lat [deg]: 83.28 / 27.49

Source network: AERONET


Geostationary surface albedo (GSA) data


“+000”


“+057/+063”


Landcover information (based on ESA CCI landcover data)


Landcover fractions @ 2km distance


Landcover fractions @ 20 km distance


Legend


Distance to open water bodies [km]:

14.13

Distance to urban areas [km]:

15.75


Radius: 1 km

Number of landcover classes:

2

Dominant landcover type:

20: cropland, irrigated or post-flooded

Fraction of dominant landcover type [%]:

84.0


Radius: 2 km

Number of landcover classes:

2

Dominant landcover type:

20: cropland, irrigated or post-flooded

Fraction of dominant landcover type [%]:

86.0


Radius: 5 km

Number of landcover classes:

2

Dominant landcover type:

20: cropland, irrigated or post-flooded

Fraction of dominant landcover type [%]:

93.0


Radius: 10 km

Number of landcover classes:

2

Dominant landcover type:

20: cropland, irrigated or post-flooded

Fraction of dominant landcover type [%]:

92.0


Radius: 20 km

Number of landcover classes:

2

Dominant landcover type:

20: cropland, irrigated or post-flooded

Fraction of dominant landcover type [%]:

93.0


Disturbances


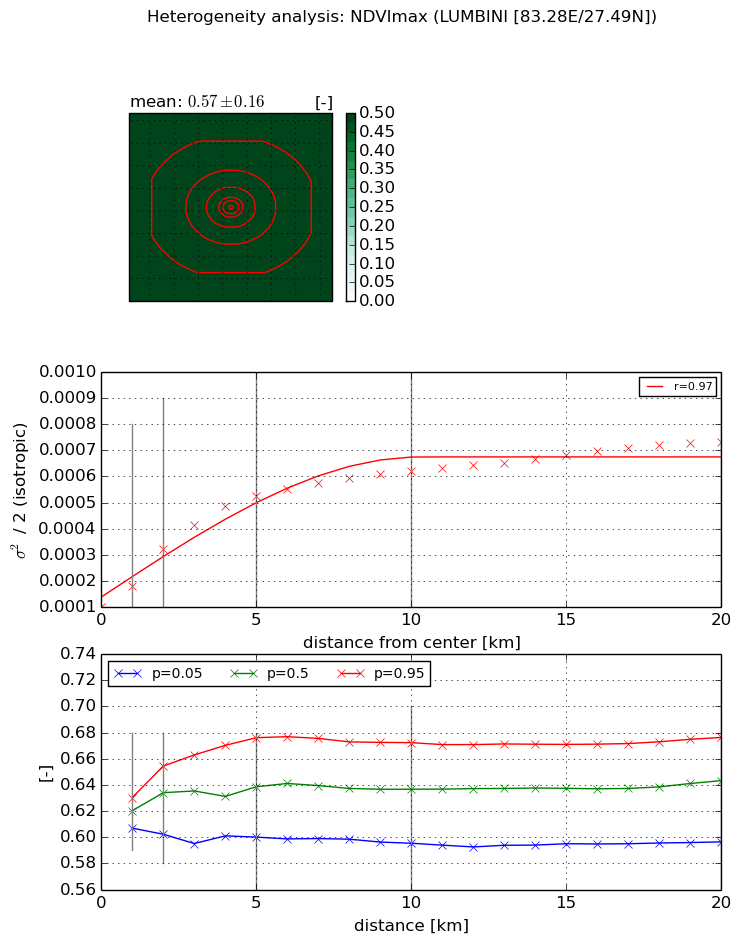
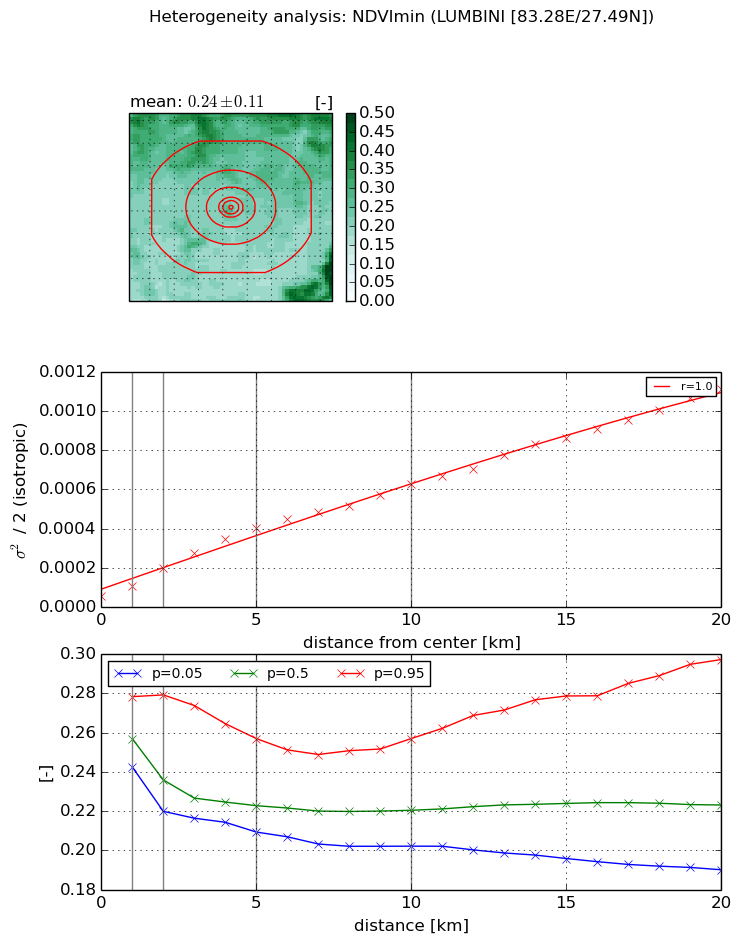
Heterogeneity analysis

The heterogeneity analysis provides information about the spatial and temporal heterogeneity of the site.

Topography


Roman et al. (2009) index


St

2.03446952239

Rcv

0.223152704628

Rse

0.0

Rst

0.251435900724

Rsv

-0.999997259405


Height range @ 1km [m]

7

Height range @ 2km [m]

8

Height range @ 5km [m]

9

Height range @ 10km [m]

-999

Height range @ 20km [m]

-999


Variance slope @ 1 km

2

Variance slope @ 2 km

1

Variance slope @ 5 km

1

Variance slope @ 10 km

-999

Variance slope @ 20 km

-999


NDVI (max. NDVI composite)


Roman et al. (2009) index


St

2.08665989765

Rcv

0.177001082733

Rse

0.0

Rst

-0.260703349755

Rsv

-0.99999991185


NDVI range @ 1km [-]

0.02

NDVI range @ 2km [-]

0.05

NDVI range @ 5km [-]

0.08

NDVI range @ 10km [-]

0.08

NDVI range @ 20km [-]

0.08


Variance slope @ 1 km

7.86216389138e-05

Variance slope @ 2 km

0.000110751954551

Variance slope @ 5 km

8.90179880685e-05

Variance slope @ 10 km

5.00036491785e-05

Variance slope @ 20 km

2.5087019258e-05


NDVI (min. NDVI composite)I


Roman et al. (2009) index


St

5.70400834617

Rcv

-0.16206421228

Rse

0.0

Rst

0.105470966367

Rsv

0.258410755849


NDVI range @ 1km [-]

0.04

NDVI range @ 2km [-]

0.06

NDVI range @ 5km [-]

0.05

NDVI range @ 10km [-]

0.05

NDVI range @ 20km [-]

0.11


NDVI slope @ 1 km

5.04989449424e-05

NDVI slope @ 2 km

7.21700408035e-05

NDVI slope @ 5 km

7.26437378654e-05

NDVI slope @ 10 km

5.6184508974e-05

NDVI slope @ 20 km

5.05628194738e-05


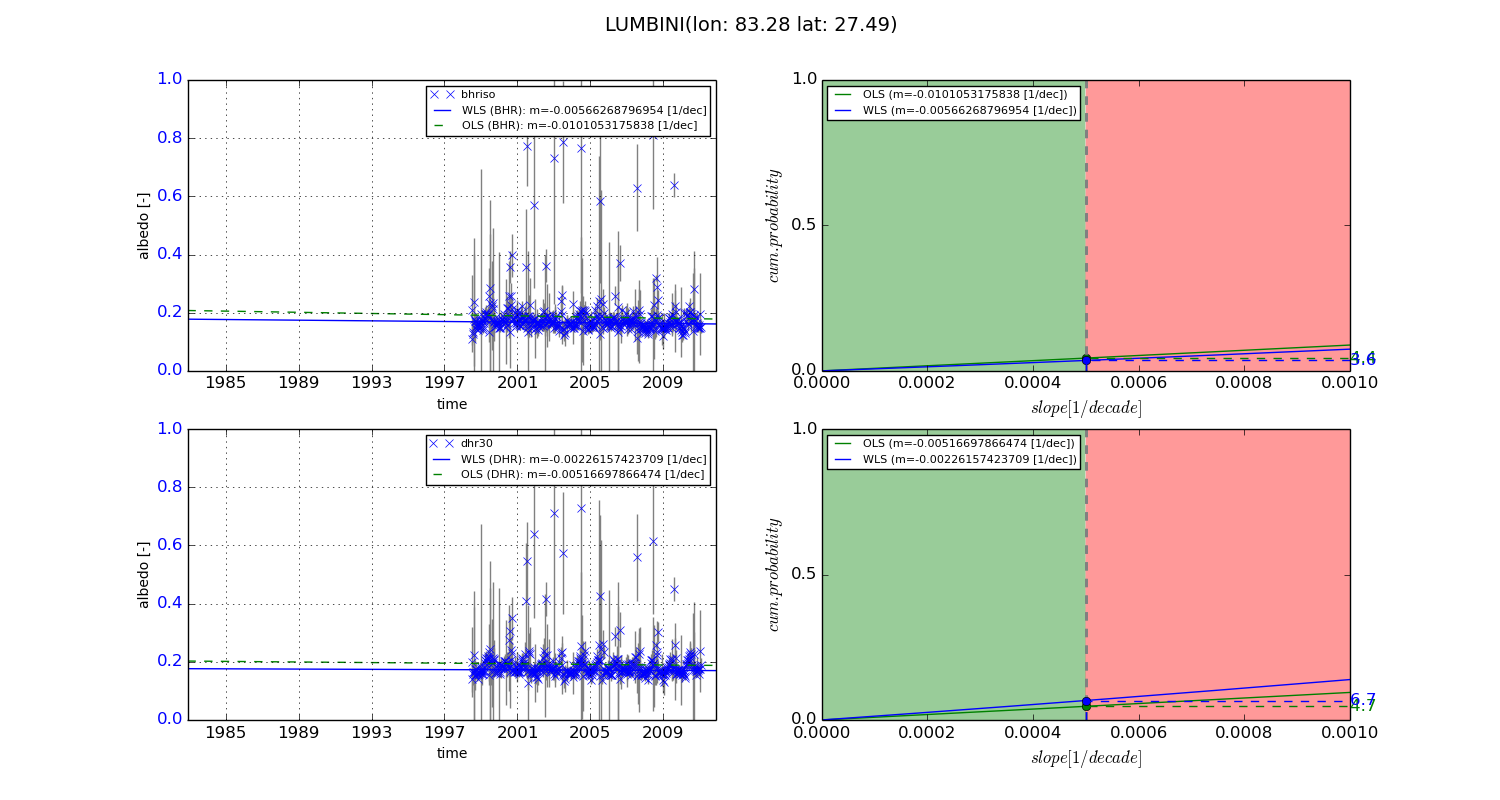
Temporal stability analysis

+000 deg (BHR)


BHR statistics

Temporal stability [1/decade]:


abs

rel


Weighted least square:

None


Ordinary least square:

None


Probabilities that GCOS criteria is met:

Weighted least square:

None %

Ordinary least square:

None %


DHR statistics

Temporal stability [1/decade]:


abs

rel


Weighted least square:

None


Ordinary least square:

None


Probabilities that GCOS criteria is met:

Weighted least square:

None %

Ordinary least square:

None %


+057/+063 deg (BHR)


BHR statistics

Temporal stability [1/decade]:


abs

rel


Weighted least square:

-0.00566268796954


Ordinary least square:

-0.0101053175838


Probabilities that GCOS criteria is met:

Weighted least square:

3.6 %

Ordinary least square:

4.4 %


DHR statistics

Temporal stability [1/decade]:


abs

rel


Weighted least square:

-0.00226157423709


Ordinary least square:

-0.00516697866474


Probabilities that GCOS criteria is met:

Weighted least square:

6.7 %

Ordinary least square:

4.7 %


Temporal anomaly analyis

The variance of the temporal anomalies provides an additional measure about the stability of the signal AFTER removal of the mean seasonal cylce.

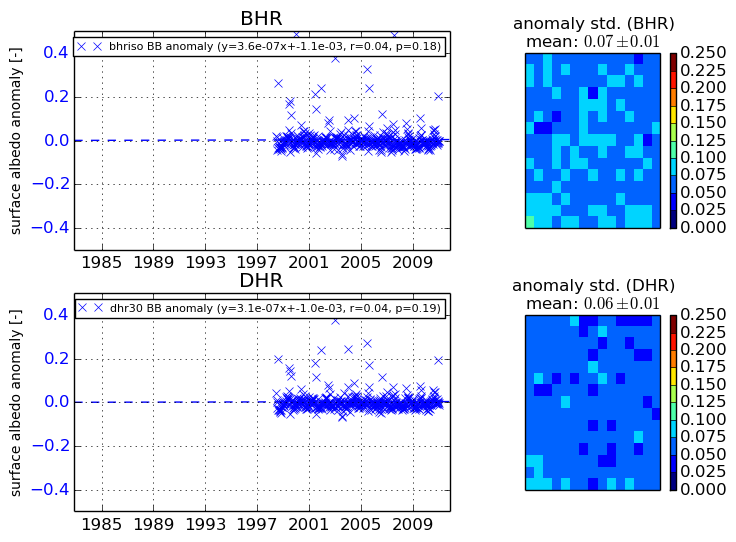
+000 deg


+057/+063 deg