LUT_DESERT_00003


Location

lon / lat [deg]: 59.4 / 30.403

Source network: ALBEDOVAL2


Geostationary surface albedo (GSA) data


“+000”


“+057/+063”


Landcover information (based on ESA CCI landcover data)


Landcover fractions @ 2km distance


Landcover fractions @ 20 km distance


Legend


Distance to open water bodies [km]:

none in region

Distance to urban areas [km]:

none in region


Radius: 1 km

Number of landcover classes:

1

Dominant landcover type:

200: bare areas

Fraction of dominant landcover type [%]:

100.0


Radius: 2 km

Number of landcover classes:

1

Dominant landcover type:

200: bare areas

Fraction of dominant landcover type [%]:

100.0


Radius: 5 km

Number of landcover classes:

1

Dominant landcover type:

200: bare areas

Fraction of dominant landcover type [%]:

100.0


Radius: 10 km

Number of landcover classes:

1

Dominant landcover type:

200: bare areas

Fraction of dominant landcover type [%]:

100.0


Radius: 20 km

Number of landcover classes:

1

Dominant landcover type:

200: bare areas

Fraction of dominant landcover type [%]:

100.0


Disturbances


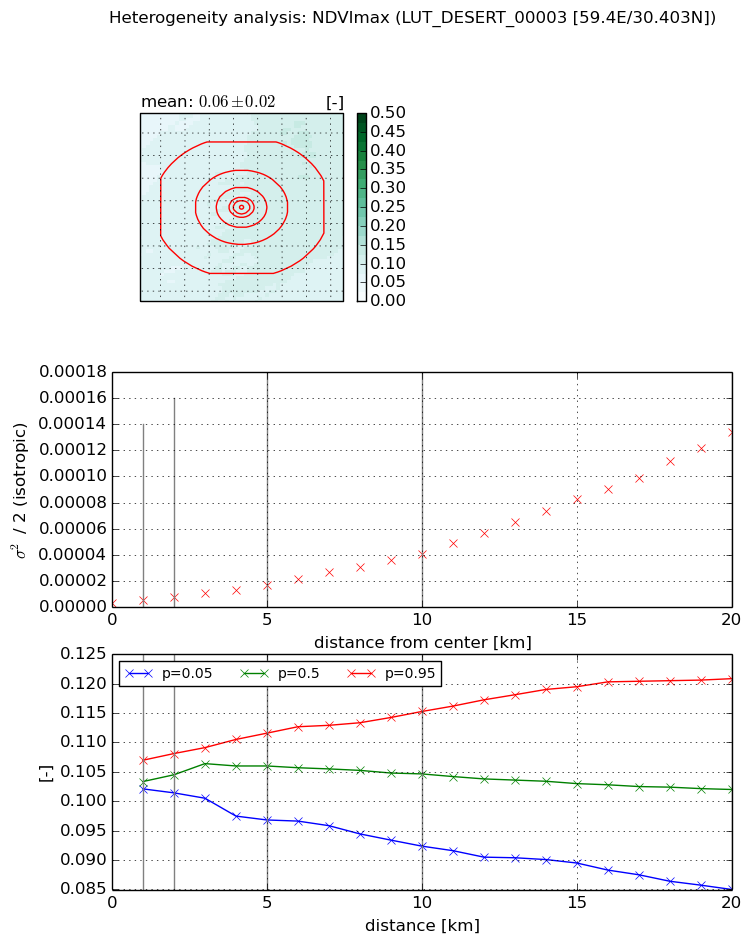
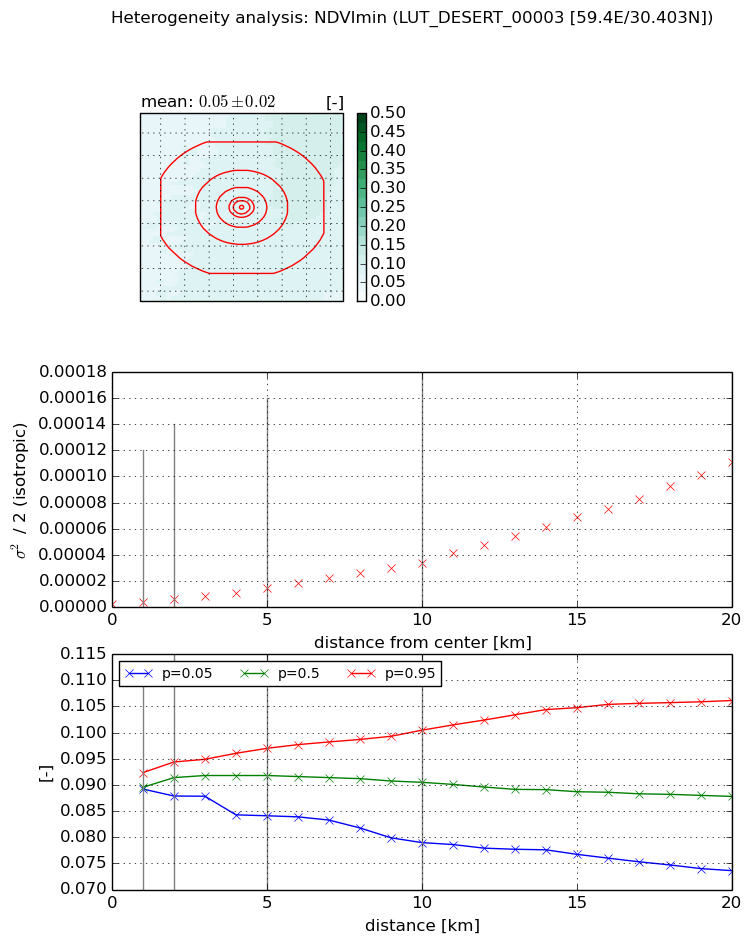
Heterogeneity analysis

The heterogeneity analysis provides information about the spatial and temporal heterogeneity of the site.

Topography


Roman et al. (2009) index


St

3.53042205729

Rcv

0.127912172039

Rse

0.0

Rst

-0.114075058037

Rsv

0.607769527422


Height range @ 1km [m]

77

Height range @ 2km [m]

105

Height range @ 5km [m]

134

Height range @ 10km [m]

-999

Height range @ 20km [m]

-999


Variance slope @ 1 km

537

Variance slope @ 2 km

601

Variance slope @ 5 km

328

Variance slope @ 10 km

-999

Variance slope @ 20 km

-999


NDVI (max. NDVI composite)


Roman et al. (2009) index


St

1.30586529989

Rcv

0.70382951526

Rse

0.0

Rst

-0.593498387136

Rsv

-0.99999939487


NDVI range @ 1km [-]

0.0

NDVI range @ 2km [-]

0.01

NDVI range @ 5km [-]

0.01

NDVI range @ 10km [-]

0.02

NDVI range @ 20km [-]

0.04


Variance slope @ 1 km

2.47151512691e-06

Variance slope @ 2 km

2.44213790181e-06

Variance slope @ 5 km

2.74089450022e-06

Variance slope @ 10 km

3.82489057186e-06

Variance slope @ 20 km

6.48026197006e-06


NDVI (min. NDVI composite)I


Roman et al. (2009) index


St

1.31312316253

Rcv

0.727418282683

Rse

0.0

Rst

-0.557214367022

Rsv

-0.999996915604


NDVI range @ 1km [-]

0.0

NDVI range @ 2km [-]

0.01

NDVI range @ 5km [-]

0.01

NDVI range @ 10km [-]

0.02

NDVI range @ 20km [-]

0.03


NDVI slope @ 1 km

2.00628733633e-06

NDVI slope @ 2 km

2.05189410415e-06

NDVI slope @ 5 km

2.39474808044e-06

NDVI slope @ 10 km

3.25793741831e-06

NDVI slope @ 20 km

5.41029530096e-06


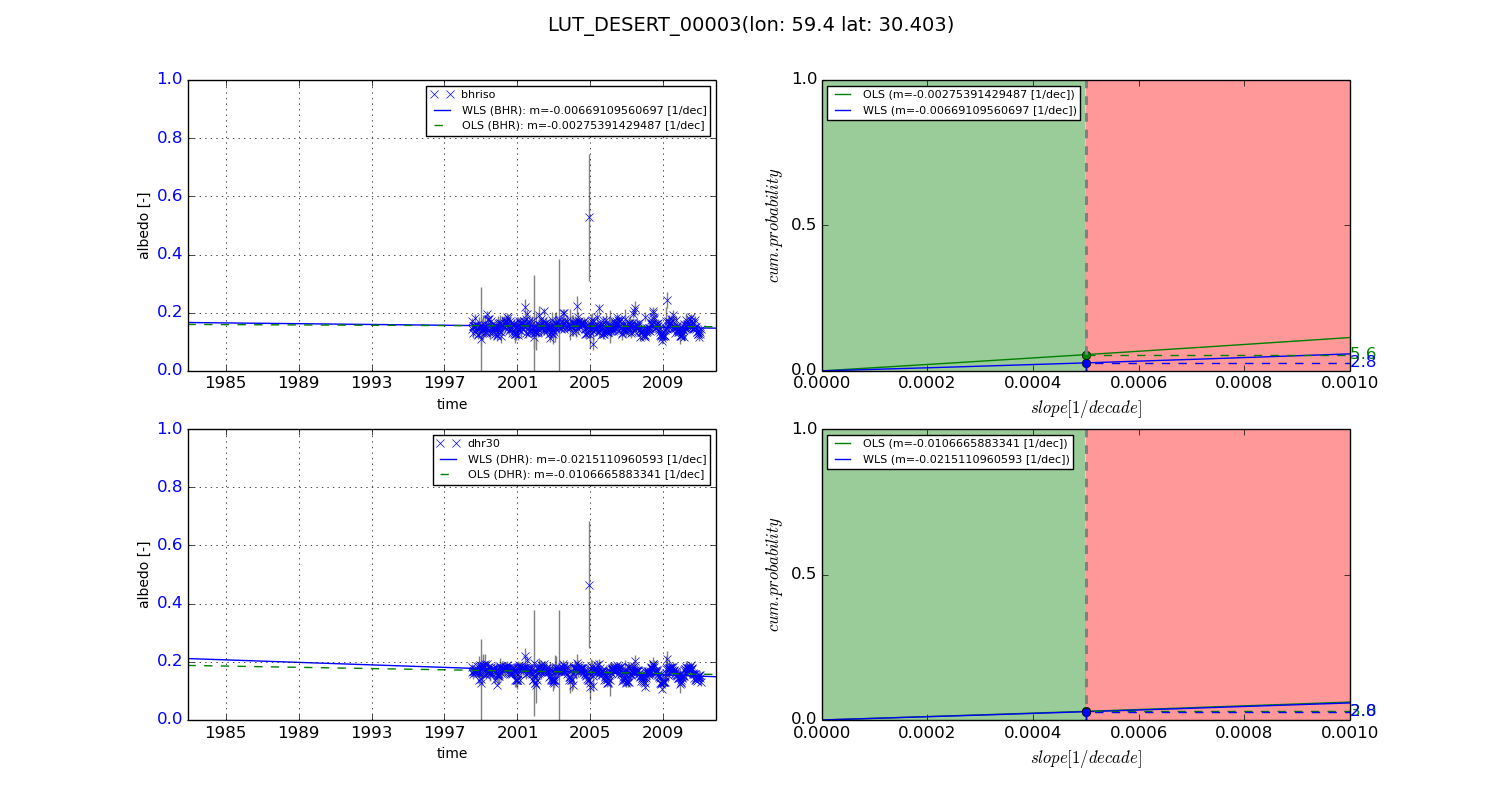
Temporal stability analysis

+000 deg (BHR)


BHR statistics

Temporal stability [1/decade]:


abs

rel


Weighted least square:

-99999.0


Ordinary least square:

-99999.0


Probabilities that GCOS criteria is met:

Weighted least square:

-99999.0 %

Ordinary least square:

-99999.0 %


DHR statistics

Temporal stability [1/decade]:


abs

rel


Weighted least square:

-99999.0


Ordinary least square:

-99999.0


Probabilities that GCOS criteria is met:

Weighted least square:

-99999.0 %

Ordinary least square:

-99999.0 %


+057/+063 deg (BHR)


BHR statistics

Temporal stability [1/decade]:


abs

rel


Weighted least square:

-0.00669109560697


Ordinary least square:

-0.00275391429487


Probabilities that GCOS criteria is met:

Weighted least square:

2.8 %

Ordinary least square:

5.6 %


DHR statistics

Temporal stability [1/decade]:


abs

rel


Weighted least square:

-0.0215110960593


Ordinary least square:

-0.0106665883341


Probabilities that GCOS criteria is met:

Weighted least square:

2.8 %

Ordinary least square:

3.0 %


Temporal anomaly analyis

The variance of the temporal anomalies provides an additional measure about the stability of the signal AFTER removal of the mean seasonal cylce.
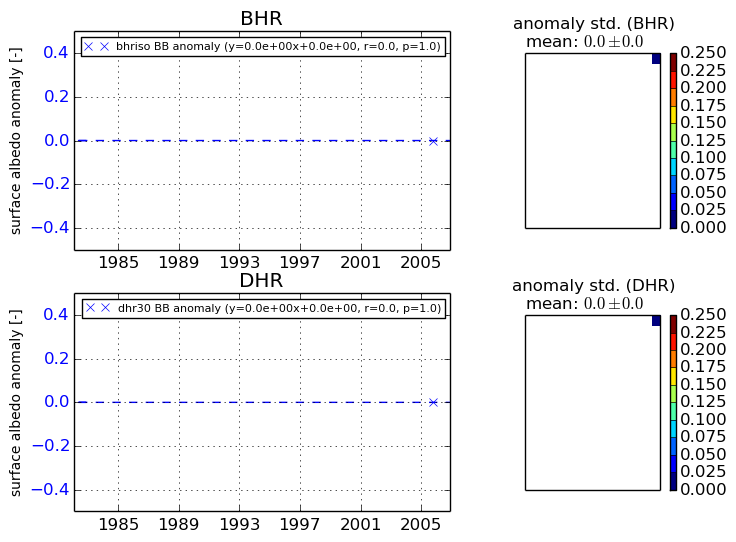
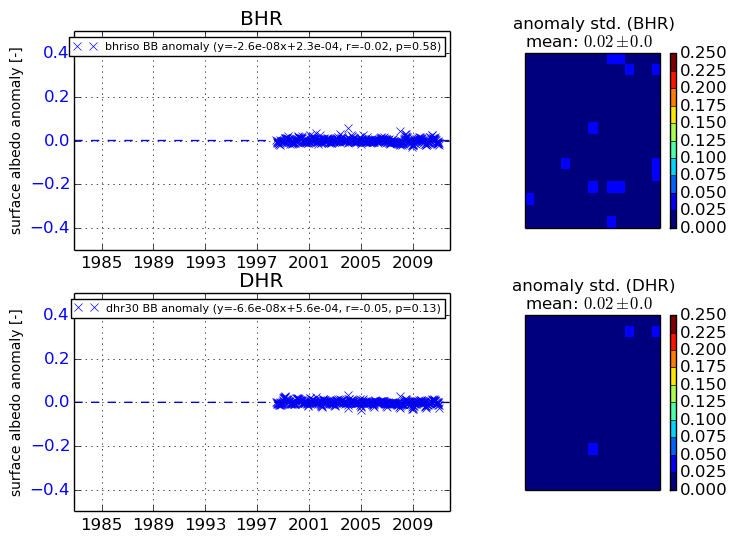
+000 deg


+057/+063 deg