MAINZ


Location

lon / lat [deg]: 8.3 / 49.999

Source network: AERONET


Geostationary surface albedo (GSA) data


“+000”


“+057/+063”


Landcover information (based on ESA CCI landcover data)


Landcover fractions @ 2km distance


Landcover fractions @ 20 km distance


Legend


Distance to open water bodies [km]:

0.37

Distance to urban areas [km]:

0.11


Radius: 1 km

Number of landcover classes:

2

Dominant landcover type:

190: urban areas

Fraction of dominant landcover type [%]:

79.0


Radius: 2 km

Number of landcover classes:

2

Dominant landcover type:

190: urban areas

Fraction of dominant landcover type [%]:

83.0


Radius: 5 km

Number of landcover classes:

3

Dominant landcover type:

190: urban areas

Fraction of dominant landcover type [%]:

83.0


Radius: 10 km

Number of landcover classes:

4

Dominant landcover type:

190: urban areas

Fraction of dominant landcover type [%]:

68.0


Radius: 20 km

Number of landcover classes:

7

Dominant landcover type:

190: urban areas

Fraction of dominant landcover type [%]:

44.0


Disturbances


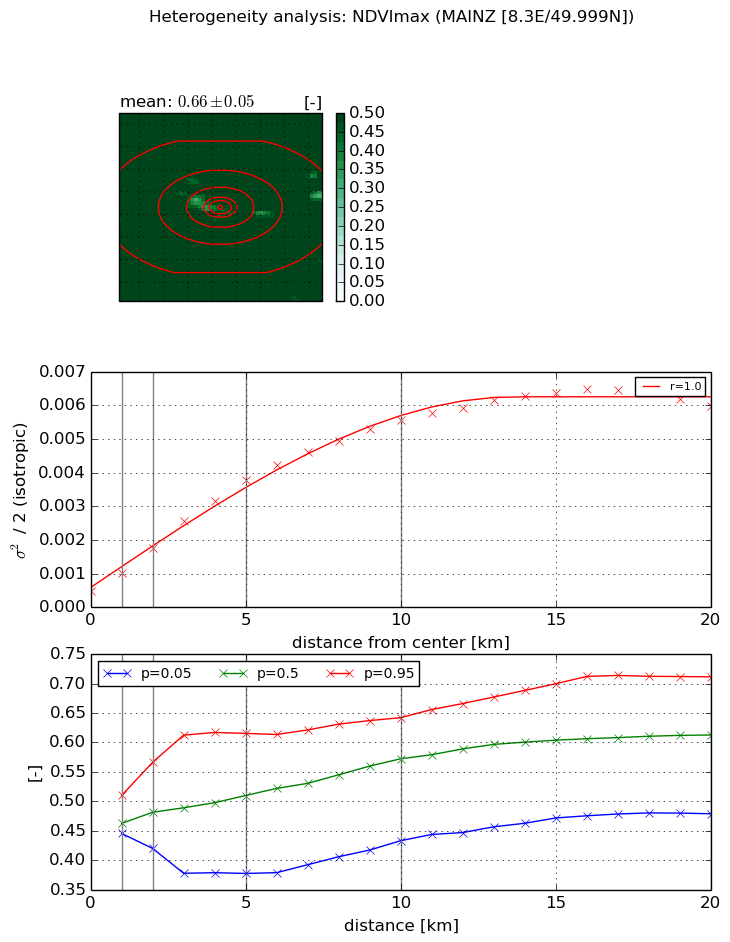
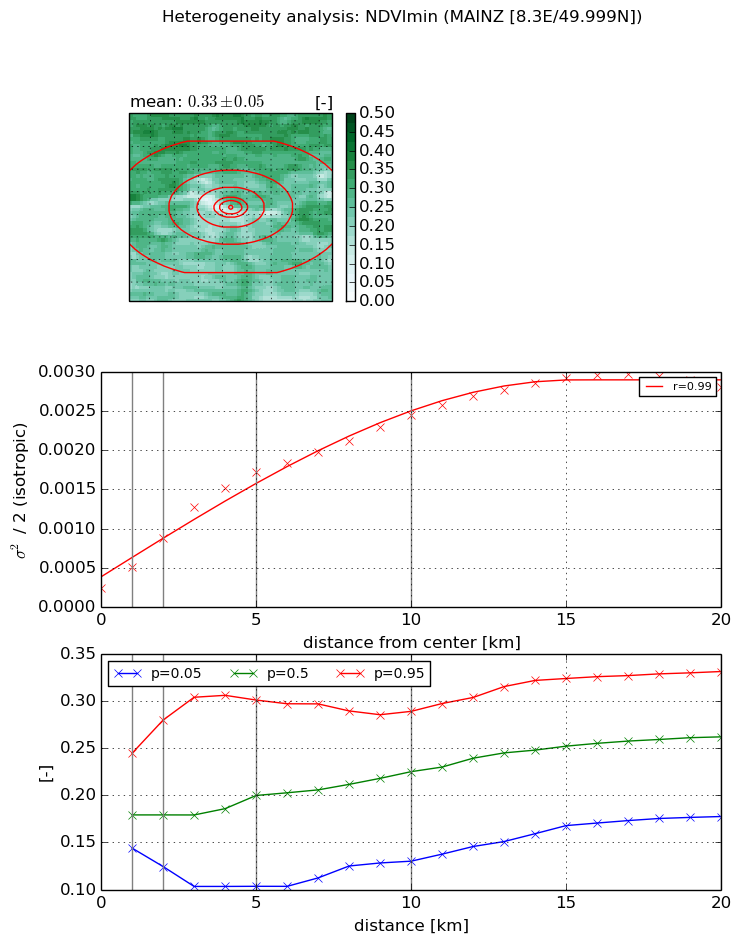
Heterogeneity analysis

The heterogeneity analysis provides information about the spatial and temporal heterogeneity of the site.

Topography


Roman et al. (2009) index


St

2.84289826459

Rcv

0.376654212119

Rse

0.0

Rst

-0.0360066895088

Rsv

0.642600216004


Height range @ 1km [m]

9

Height range @ 2km [m]

36

Height range @ 5km [m]

63

Height range @ 10km [m]

-999

Height range @ 20km [m]

-999


Variance slope @ 1 km

152

Variance slope @ 2 km

165

Variance slope @ 5 km

166

Variance slope @ 10 km

-999

Variance slope @ 20 km

-999


NDVI (max. NDVI composite)


Roman et al. (2009) index


St

11.4024558102

Rcv

-0.036509595447

Rse

0.0

Rst

-0.0409024899826

Rsv

0.185689131531


NDVI range @ 1km [-]

0.06

NDVI range @ 2km [-]

0.15

NDVI range @ 5km [-]

0.24

NDVI range @ 10km [-]

0.21

NDVI range @ 20km [-]

0.23


Variance slope @ 1 km

0.00053641267266

Variance slope @ 2 km

0.000636705130856

Variance slope @ 5 km

0.000677498696696

Variance slope @ 10 km

0.000521302819767

Variance slope @ 20 km

0.000277877398832


NDVI (min. NDVI composite)I


Roman et al. (2009) index


St

13.6122796175

Rcv

-0.139815134676

Rse

0.0

Rst

-0.0199282776047

Rsv

0.0606458306896


NDVI range @ 1km [-]

0.1

NDVI range @ 2km [-]

0.16

NDVI range @ 5km [-]

0.2

NDVI range @ 10km [-]

0.16

NDVI range @ 20km [-]

0.15


NDVI slope @ 1 km

0.000272693110825

NDVI slope @ 2 km

0.00032327306731

NDVI slope @ 5 km

0.000308873789173

NDVI slope @ 10 km

0.000214846956903

NDVI slope @ 20 km

0.000127345937196


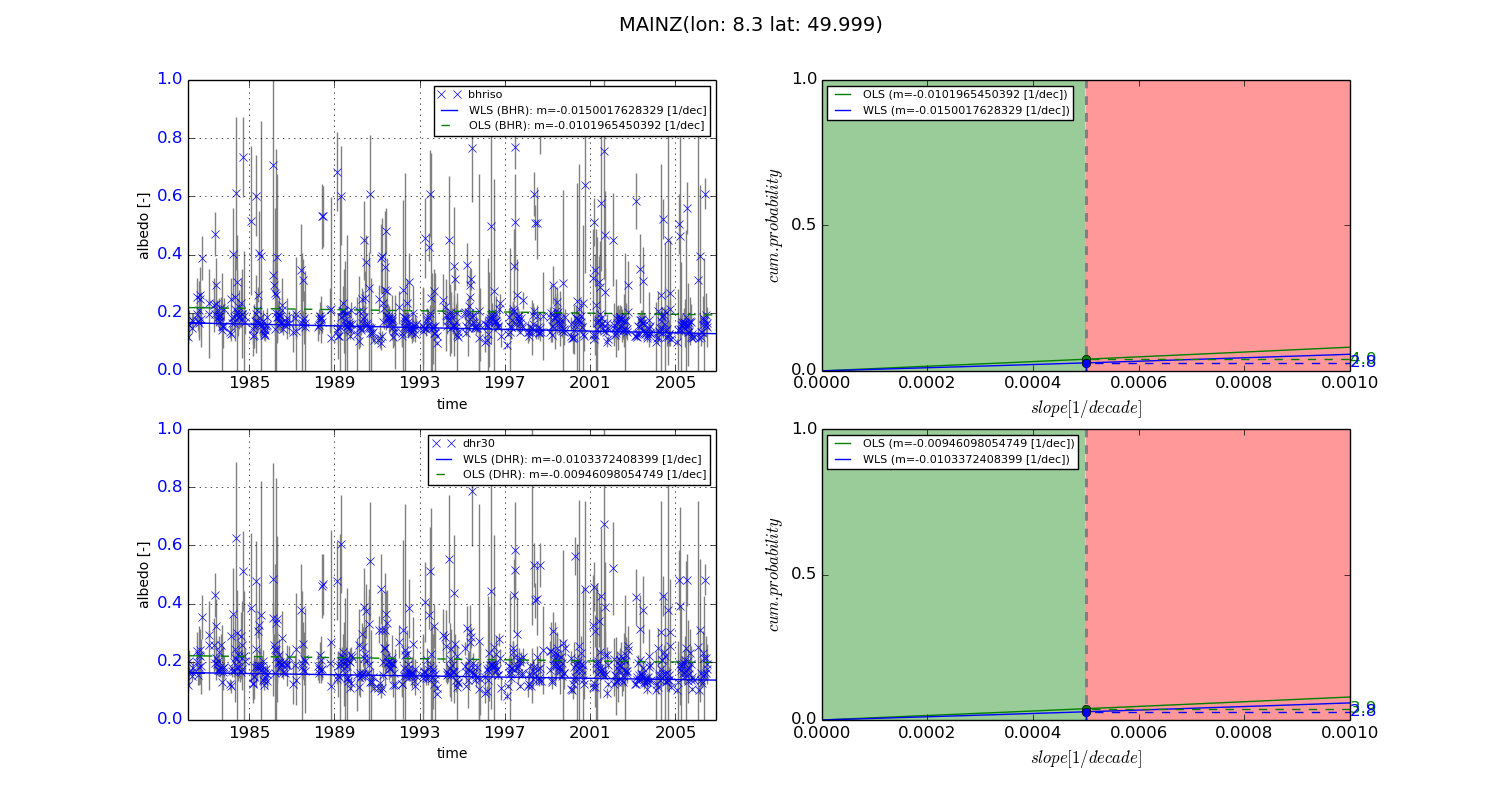
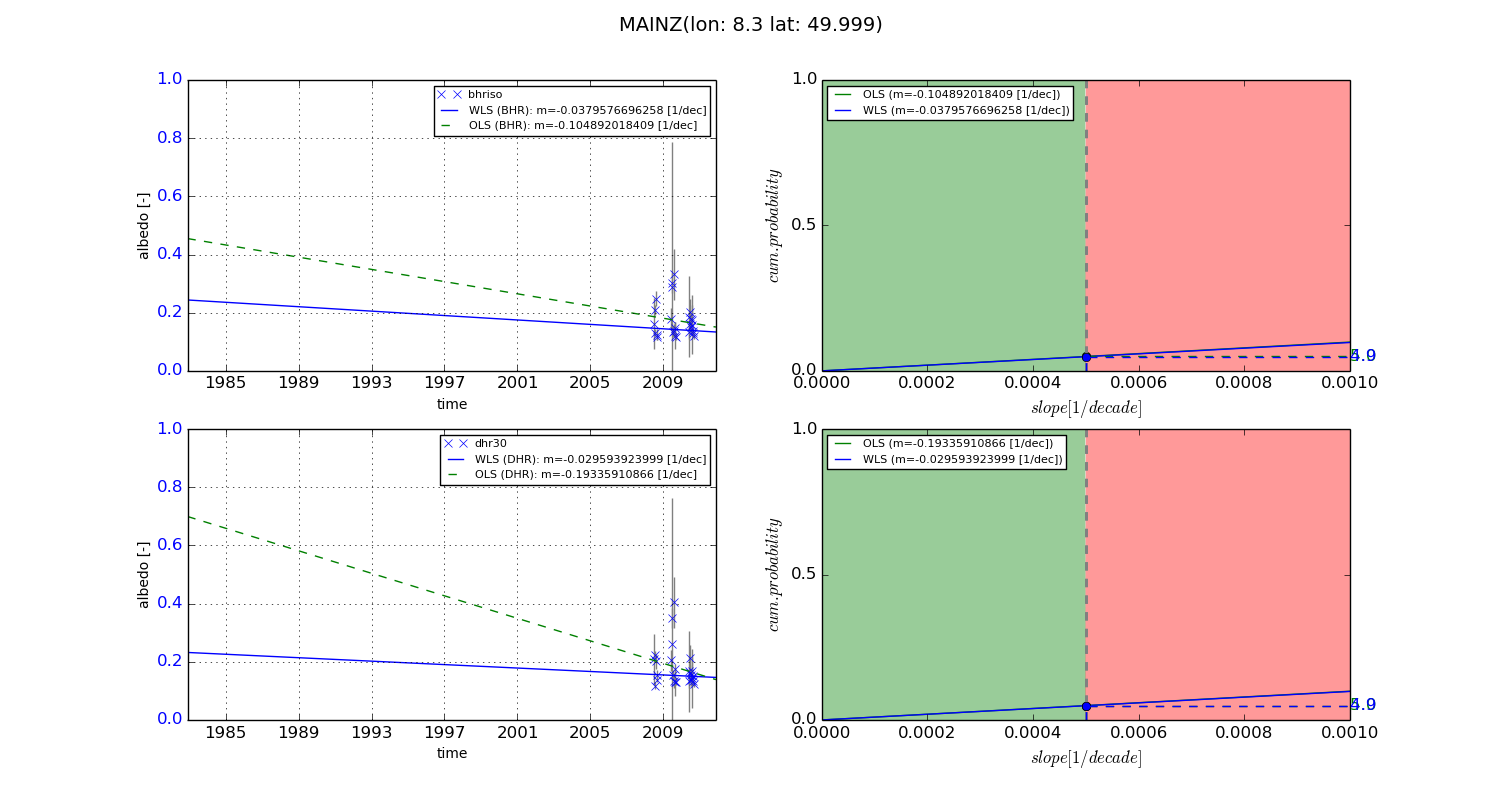
Temporal stability analysis

+000 deg (BHR)


BHR statistics

Temporal stability [1/decade]:


abs

rel


Weighted least square:

-0.0150017628329


Ordinary least square:

-0.0101965450392


Probabilities that GCOS criteria is met:

Weighted least square:

2.8 %

Ordinary least square:

4.0 %


DHR statistics

Temporal stability [1/decade]:


abs

rel


Weighted least square:

-0.0103372408399


Ordinary least square:

-0.00946098054749


Probabilities that GCOS criteria is met:

Weighted least square:

2.8 %

Ordinary least square:

3.9 %


+057/+063 deg (BHR)


BHR statistics

Temporal stability [1/decade]:


abs

rel


Weighted least square:

-0.0379576696258


Ordinary least square:

-0.104892018409


Probabilities that GCOS criteria is met:

Weighted least square:

4.9 %

Ordinary least square:

5.0 %


DHR statistics

Temporal stability [1/decade]:


abs

rel


Weighted least square:

-0.029593923999


Ordinary least square:

-0.19335910866


Probabilities that GCOS criteria is met:

Weighted least square:

4.9 %

Ordinary least square:

5.0 %


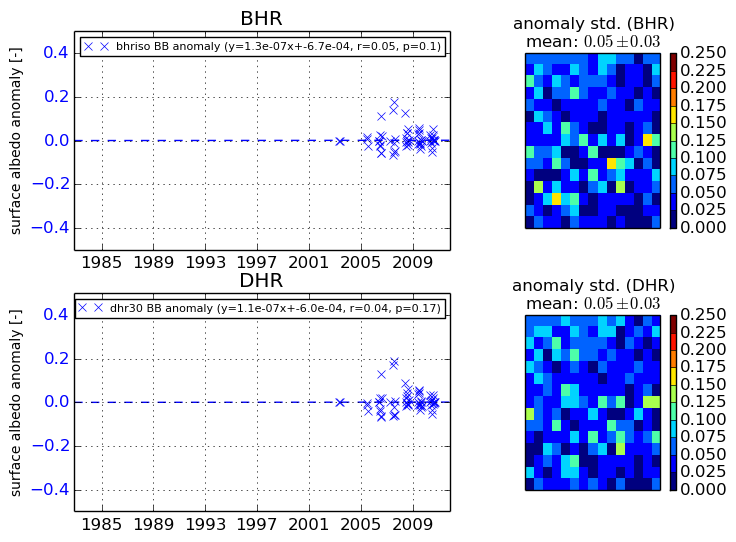
Temporal anomaly analyis

The variance of the temporal anomalies provides an additional measure about the stability of the signal AFTER removal of the mean seasonal cylce.
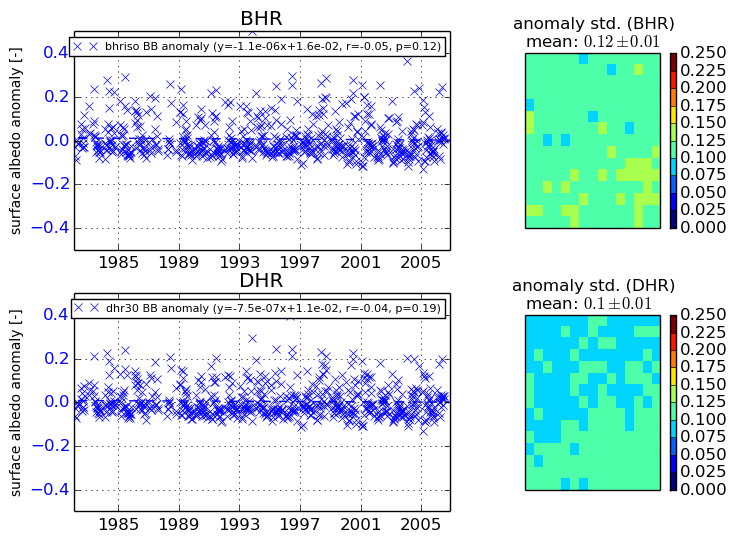
+000 deg


+057/+063 deg