MCCLELLAN_AFB


Location

lon / lat [deg]: -121.3994 / 38.6678

Source network: AERONET


Geostationary surface albedo (GSA) data


“+000”


“+057/+063”


Landcover information (based on ESA CCI landcover data)


Landcover fractions @ 2km distance


Landcover fractions @ 20 km distance


Legend


Distance to open water bodies [km]:

9.71

Distance to urban areas [km]:

0.08


Radius: 1 km

Number of landcover classes:

2

Dominant landcover type:

190: urban areas

Fraction of dominant landcover type [%]:

81.0


Radius: 2 km

Number of landcover classes:

3

Dominant landcover type:

190: urban areas

Fraction of dominant landcover type [%]:

75.0


Radius: 5 km

Number of landcover classes:

3

Dominant landcover type:

190: urban areas

Fraction of dominant landcover type [%]:

86.0


Radius: 10 km

Number of landcover classes:

3

Dominant landcover type:

190: urban areas

Fraction of dominant landcover type [%]:

76.0


Radius: 20 km

Number of landcover classes:

4

Dominant landcover type:

190: urban areas

Fraction of dominant landcover type [%]:

57.0


Disturbances


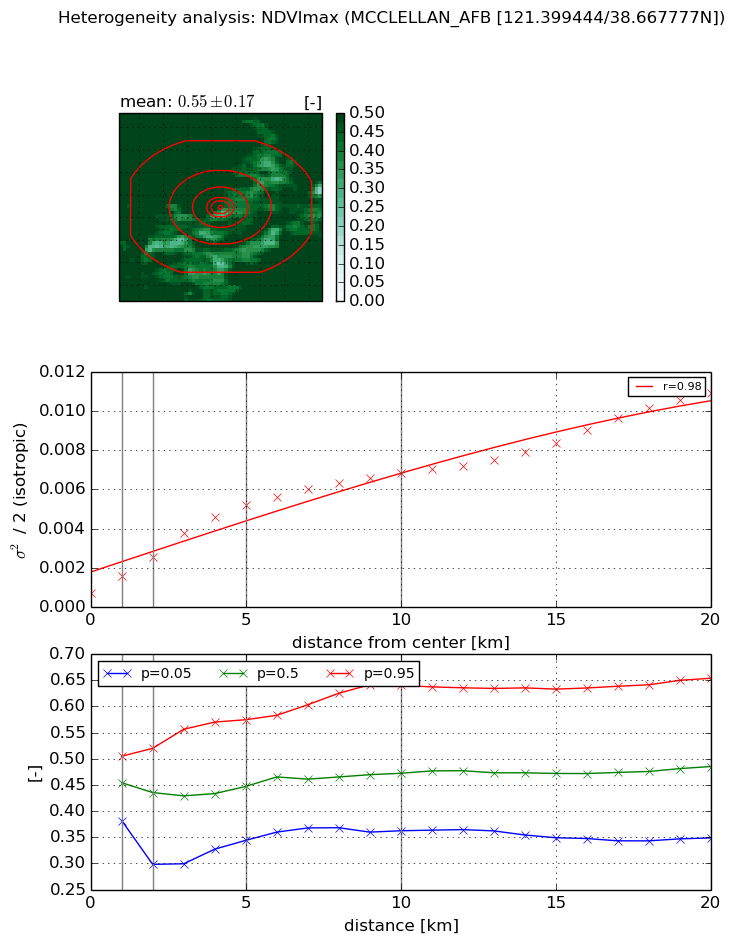
Heterogeneity analysis

The heterogeneity analysis provides information about the spatial and temporal heterogeneity of the site.

Topography


Roman et al. (2009) index


St

6.22594539005

Rcv

0.458018881468

Rse

0.0

Rst

3.05875232485e-09

Rsv

0.0238356471228


Height range @ 1km [m]

14

Height range @ 2km [m]

14

Height range @ 5km [m]

27

Height range @ 10km [m]

-999

Height range @ 20km [m]

-999


Variance slope @ 1 km

6

Variance slope @ 2 km

7

Variance slope @ 5 km

13

Variance slope @ 10 km

-999

Variance slope @ 20 km

-999


NDVI (max. NDVI composite)


Roman et al. (2009) index


St

10.9285442233

Rcv

-0.10430449304

Rse

0.0

Rst

-0.0818689809328

Rsv

0.088337013307


NDVI range @ 1km [-]

0.12

NDVI range @ 2km [-]

0.22

NDVI range @ 5km [-]

0.23

NDVI range @ 10km [-]

0.28

NDVI range @ 20km [-]

0.31


Variance slope @ 1 km

0.000839332177513

Variance slope @ 2 km

0.000915163645774

Variance slope @ 5 km

0.000930890907053

Variance slope @ 10 km

0.000611268762653

Variance slope @ 20 km

0.000444410334908


NDVI (min. NDVI composite)I


Roman et al. (2009) index


St

13.3483335469

Rcv

0.0507892443798

Rse

0.0

Rst

0.00344936938038

Rsv

-0.170508542089


NDVI range @ 1km [-]

0.05

NDVI range @ 2km [-]

0.13

NDVI range @ 5km [-]

0.21

NDVI range @ 10km [-]

0.17

NDVI range @ 20km [-]

0.2


NDVI slope @ 1 km

0.000448756109806

NDVI slope @ 2 km

0.000486473016326

NDVI slope @ 5 km

0.000464476657577

NDVI slope @ 10 km

0.000283544828392

NDVI slope @ 20 km

0.000138314377341


Temporal stability analysis

+000 deg (BHR)


BHR statistics

Temporal stability [1/decade]:


abs

rel


Weighted least square:

None


Ordinary least square:

None


Probabilities that GCOS criteria is met:

Weighted least square:

None %

Ordinary least square:

None %


DHR statistics

Temporal stability [1/decade]:


abs

rel


Weighted least square:

None


Ordinary least square:

None


Probabilities that GCOS criteria is met:

Weighted least square:

None %

Ordinary least square:

None %


+057/+063 deg (BHR)


BHR statistics

Temporal stability [1/decade]:


abs

rel


Weighted least square:

None


Ordinary least square:

None


Probabilities that GCOS criteria is met:

Weighted least square:

None %

Ordinary least square:

None %


DHR statistics

Temporal stability [1/decade]:


abs

rel


Weighted least square:

None


Ordinary least square:

None


Probabilities that GCOS criteria is met:

Weighted least square:

None %

Ordinary least square:

None %


Temporal anomaly analyis

The variance of the temporal anomalies provides an additional measure about the stability of the signal AFTER removal of the mean seasonal cylce.

+000 deg


+057/+063 deg