METOLIUSOP


Location

lon / lat [deg]: -121.62 / 44.49

Source network: EOS_LAND


Geostationary surface albedo (GSA) data


“+000”


“+057/+063”


Landcover information (based on ESA CCI landcover data)


Landcover fractions @ 2km distance


Landcover fractions @ 20 km distance


Legend


Distance to open water bodies [km]:

4.12

Distance to urban areas [km]:

9.96


Radius: 1 km

Number of landcover classes:

1

Dominant landcover type:

70: Tree cover, needleleaved, evergreen, closed to open (>15%)

Fraction of dominant landcover type [%]:

100.0


Radius: 2 km

Number of landcover classes:

1

Dominant landcover type:

70: Tree cover, needleleaved, evergreen, closed to open (>15%)

Fraction of dominant landcover type [%]:

100.0


Radius: 5 km

Number of landcover classes:

1

Dominant landcover type:

70: Tree cover, needleleaved, evergreen, closed to open (>15%)

Fraction of dominant landcover type [%]:

100.0


Radius: 10 km

Number of landcover classes:

1

Dominant landcover type:

70: Tree cover, needleleaved, evergreen, closed to open (>15%)

Fraction of dominant landcover type [%]:

99.0


Radius: 20 km

Number of landcover classes:

3

Dominant landcover type:

70: Tree cover, needleleaved, evergreen, closed to open (>15%)

Fraction of dominant landcover type [%]:

84.0


Disturbances


Heterogeneity analysis

The heterogeneity analysis provides information about the spatial and temporal heterogeneity of the site.

Topography


Roman et al. (2009) index


St

2.58955725814

Rcv

-0.0649466375102

Rse

0.0

Rst

-0.0935539034223

Rsv

-0.99999865447


Height range @ 1km [m]

365

Height range @ 2km [m]

546

Height range @ 5km [m]

540

Height range @ 10km [m]

-999

Height range @ 20km [m]

-999


Variance slope @ 1 km

5973

Variance slope @ 2 km

8164

Variance slope @ 5 km

8948

Variance slope @ 10 km

-999

Variance slope @ 20 km

-999


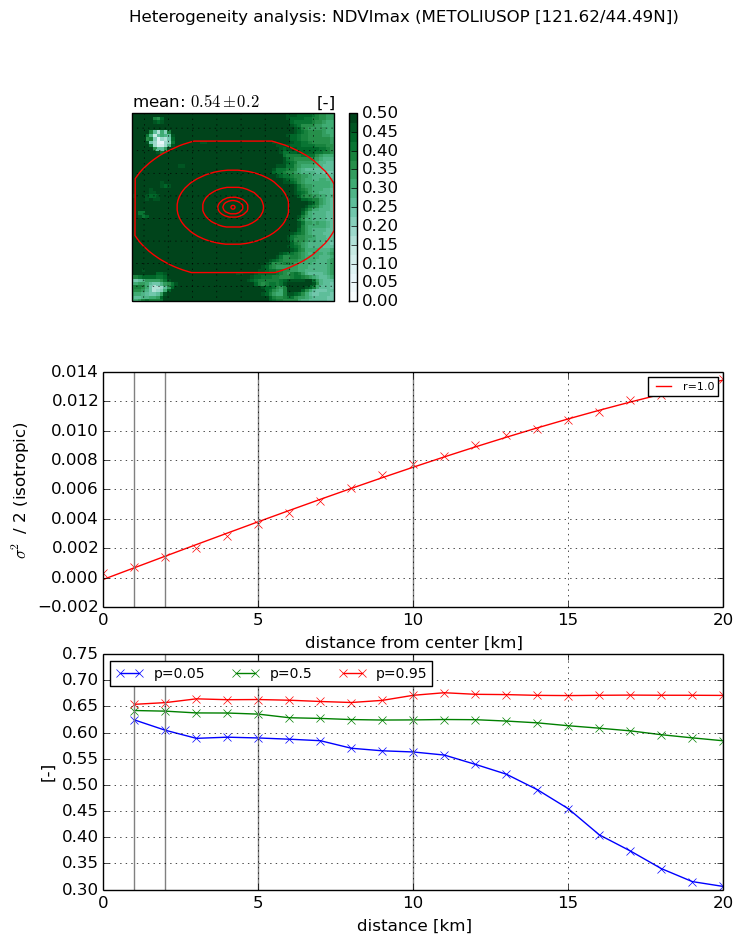
NDVI (max. NDVI composite)


Roman et al. (2009) index


St

3.68711341679

Rcv

0.0275445125506

Rse

0.0

Rst

0.149479766322

Rsv

0.63662034251


NDVI range @ 1km [-]

0.03

NDVI range @ 2km [-]

0.05

NDVI range @ 5km [-]

0.07

NDVI range @ 10km [-]

0.11

NDVI range @ 20km [-]

0.37


Variance slope @ 1 km

0.000410170376212

Variance slope @ 2 km

0.000529385944037

Variance slope @ 5 km

0.000671128353979

Variance slope @ 10 km

0.000764462847937

Variance slope @ 20 km

0.000687612908438


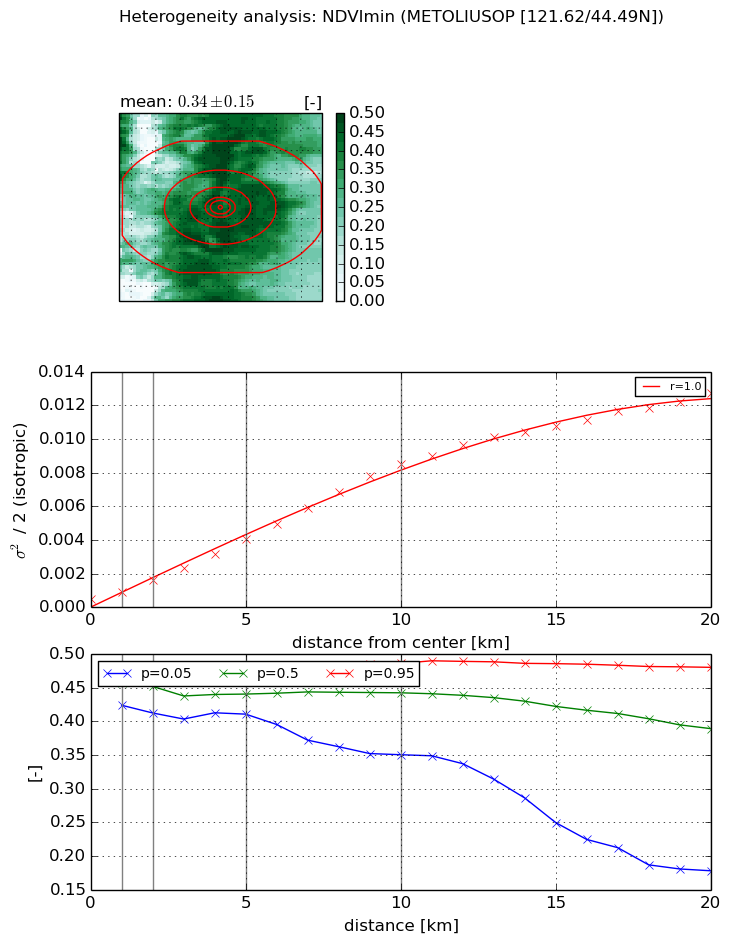
NDVI (min. NDVI composite)I


Roman et al. (2009) index


St

6.3492033061

Rcv

0.0212718919494

Rse

0.0

Rst

-0.311683960459

Rsv

0.139544374055


NDVI range @ 1km [-]

0.04

NDVI range @ 2km [-]

0.05

NDVI range @ 5km [-]

0.07

NDVI range @ 10km [-]

0.14

NDVI range @ 20km [-]

0.3


NDVI slope @ 1 km

0.000444491145717

NDVI slope @ 2 km

0.000566303507178

NDVI slope @ 5 km

0.00071830687223

NDVI slope @ 10 km

0.000838571949632

NDVI slope @ 20 km

0.000642420749281


Temporal stability analysis

+000 deg (BHR)


BHR statistics

Temporal stability [1/decade]:


abs

rel


Weighted least square:

None


Ordinary least square:

None


Probabilities that GCOS criteria is met:

Weighted least square:

None %

Ordinary least square:

None %


DHR statistics

Temporal stability [1/decade]:


abs

rel


Weighted least square:

None


Ordinary least square:

None


Probabilities that GCOS criteria is met:

Weighted least square:

None %

Ordinary least square:

None %


+057/+063 deg (BHR)


BHR statistics

Temporal stability [1/decade]:


abs

rel


Weighted least square:

None


Ordinary least square:

None


Probabilities that GCOS criteria is met:

Weighted least square:

None %

Ordinary least square:

None %


DHR statistics

Temporal stability [1/decade]:


abs

rel


Weighted least square:

None


Ordinary least square:

None


Probabilities that GCOS criteria is met:

Weighted least square:

None %

Ordinary least square:

None %


Temporal anomaly analyis

The variance of the temporal anomalies provides an additional measure about the stability of the signal AFTER removal of the mean seasonal cylce.

+000 deg


+057/+063 deg