MOBILE_N_62308


Location

lon / lat [deg]: 80.4783 / 26.513

Source network: AERONET


Geostationary surface albedo (GSA) data


“+000”


“+057/+063”


Landcover information (based on ESA CCI landcover data)


Landcover fractions @ 2km distance


Landcover fractions @ 20 km distance


Legend


Distance to open water bodies [km]:

4.01

Distance to urban areas [km]:

1.84


Radius: 1 km

Number of landcover classes:

1

Dominant landcover type:

20: cropland, irrigated or post-flooded

Fraction of dominant landcover type [%]:

100.0


Radius: 2 km

Number of landcover classes:

4

Dominant landcover type:

20: cropland, irrigated or post-flooded

Fraction of dominant landcover type [%]:

94.0


Radius: 5 km

Number of landcover classes:

4

Dominant landcover type:

20: cropland, irrigated or post-flooded

Fraction of dominant landcover type [%]:

83.0


Radius: 10 km

Number of landcover classes:

3

Dominant landcover type:

20: cropland, irrigated or post-flooded

Fraction of dominant landcover type [%]:

80.0


Radius: 20 km

Number of landcover classes:

3

Dominant landcover type:

20: cropland, irrigated or post-flooded

Fraction of dominant landcover type [%]:

72.0


Disturbances


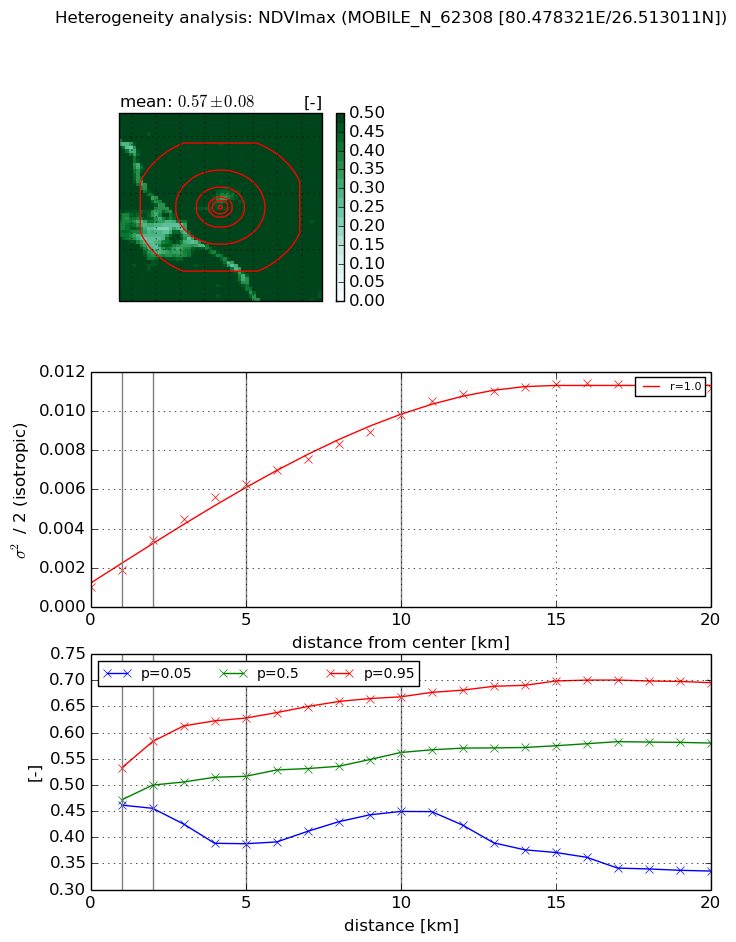
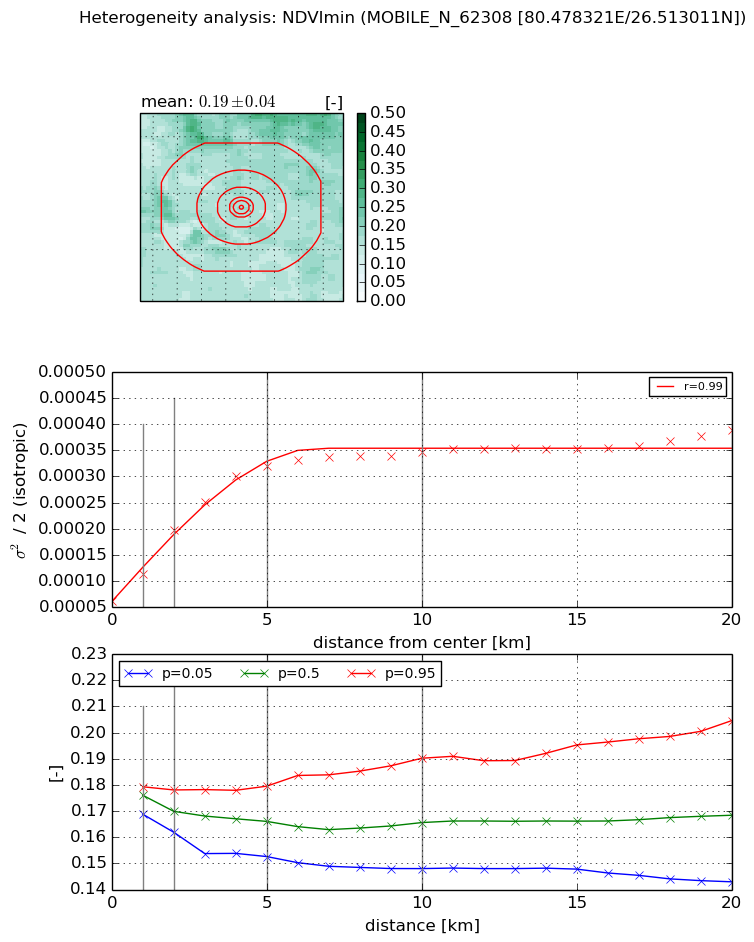
Heterogeneity analysis

The heterogeneity analysis provides information about the spatial and temporal heterogeneity of the site.

Topography


Roman et al. (2009) index


St

0.00221343898448

Rcv

0.720413553462

Rse

0.0

Rst

0.0355039356851

Rsv

1354.60107271


Height range @ 1km [m]

7

Height range @ 2km [m]

6

Height range @ 5km [m]

14

Height range @ 10km [m]

-999

Height range @ 20km [m]

-999


Variance slope @ 1 km

4

Variance slope @ 2 km

4

Variance slope @ 5 km

4

Variance slope @ 10 km

-999

Variance slope @ 20 km

-999


NDVI (max. NDVI composite)


Roman et al. (2009) index


St

2.96643583194

Rcv

0.240240809266

Rse

0.0

Rst

-0.219573517084

Rsv

0.55150031855


NDVI range @ 1km [-]

0.07

NDVI range @ 2km [-]

0.13

NDVI range @ 5km [-]

0.24

NDVI range @ 10km [-]

0.22

NDVI range @ 20km [-]

0.36


Variance slope @ 1 km

0.00088523835965

Variance slope @ 2 km

0.00120036970008

Variance slope @ 5 km

0.00109798474846

Variance slope @ 10 km

0.000855726503383

Variance slope @ 20 km

0.00050778591388


NDVI (min. NDVI composite)I


Roman et al. (2009) index


St

2.60543329949

Rcv

0.186996519955

Rse

0.0

Rst

0.22303263973

Rsv

0.741410794883


NDVI range @ 1km [-]

0.01

NDVI range @ 2km [-]

0.02

NDVI range @ 5km [-]

0.03

NDVI range @ 10km [-]

0.04

NDVI range @ 20km [-]

0.06


NDVI slope @ 1 km

5.16146112992e-05

NDVI slope @ 2 km

6.78007497832e-05

NDVI slope @ 5 km

5.43994901075e-05

NDVI slope @ 10 km

2.68112927637e-05

NDVI slope @ 20 km

1.08885471652e-05


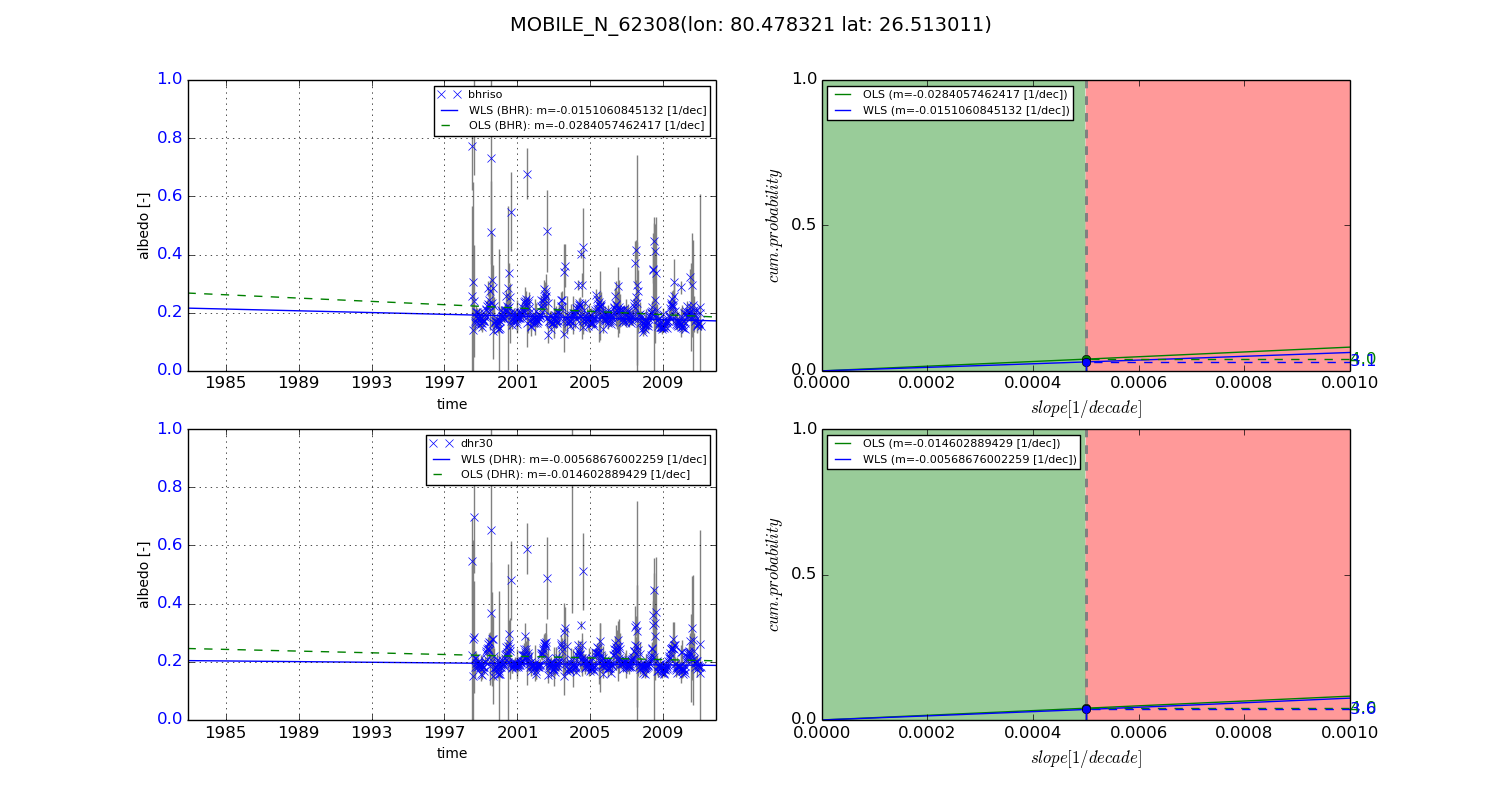
Temporal stability analysis

+000 deg (BHR)


BHR statistics

Temporal stability [1/decade]:


abs

rel


Weighted least square:

None


Ordinary least square:

None


Probabilities that GCOS criteria is met:

Weighted least square:

None %

Ordinary least square:

None %


DHR statistics

Temporal stability [1/decade]:


abs

rel


Weighted least square:

None


Ordinary least square:

None


Probabilities that GCOS criteria is met:

Weighted least square:

None %

Ordinary least square:

None %


+057/+063 deg (BHR)


BHR statistics

Temporal stability [1/decade]:


abs

rel


Weighted least square:

-0.0151060845132


Ordinary least square:

-0.0284057462417


Probabilities that GCOS criteria is met:

Weighted least square:

3.1 %

Ordinary least square:

4.0 %


DHR statistics

Temporal stability [1/decade]:


abs

rel


Weighted least square:

-0.00568676002259


Ordinary least square:

-0.014602889429


Probabilities that GCOS criteria is met:

Weighted least square:

3.6 %

Ordinary least square:

4.0 %


Temporal anomaly analyis

The variance of the temporal anomalies provides an additional measure about the stability of the signal AFTER removal of the mean seasonal cylce.

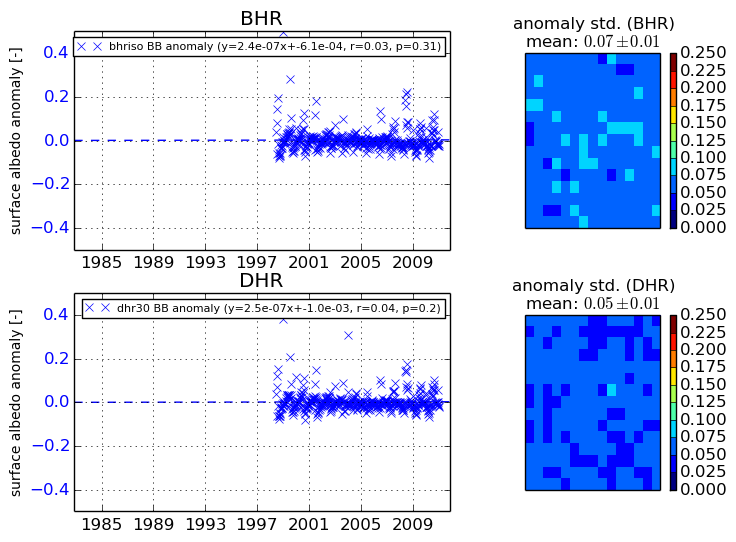
+000 deg


+057/+063 deg