MONCLOVA


Location

lon / lat [deg]: -101.47 / 25.95

Source network: AERONET


Geostationary surface albedo (GSA) data


“+000”


“+057/+063”


Landcover information (based on ESA CCI landcover data)


Landcover fractions @ 2km distance


Landcover fractions @ 20 km distance


Legend


Distance to open water bodies [km]:

24.81

Distance to urban areas [km]:

68.87


Radius: 1 km

Number of landcover classes:

2

Dominant landcover type:

70: Tree cover, needleleaved, evergreen, closed to open (>15%)

Fraction of dominant landcover type [%]:

62.0


Radius: 2 km

Number of landcover classes:

2

Dominant landcover type:

60: Tree cover, broadleaved, decidous

Fraction of dominant landcover type [%]:

58.0


Radius: 5 km

Number of landcover classes:

3

Dominant landcover type:

60: Tree cover, broadleaved, decidous

Fraction of dominant landcover type [%]:

57.0


Radius: 10 km

Number of landcover classes:

3

Dominant landcover type:

60: Tree cover, broadleaved, decidous

Fraction of dominant landcover type [%]:

39.0


Radius: 20 km

Number of landcover classes:

3

Dominant landcover type:

120: Shrubland

Fraction of dominant landcover type [%]:

58.0


Disturbances


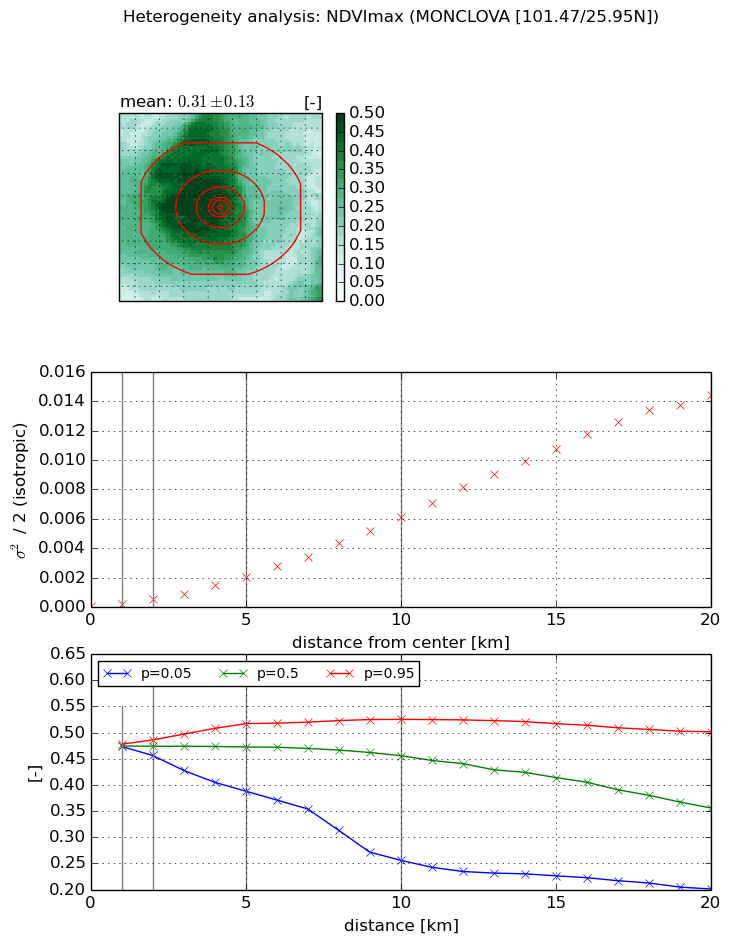
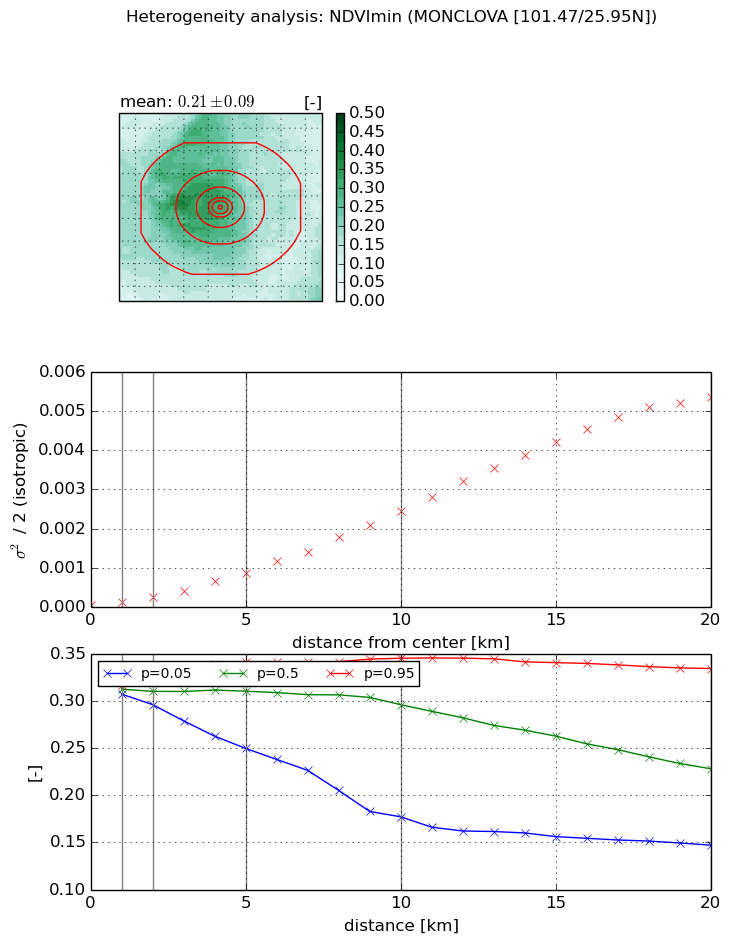
Heterogeneity analysis

The heterogeneity analysis provides information about the spatial and temporal heterogeneity of the site.

Topography


Roman et al. (2009) index


St

1.9593875252

Rcv

0.531090398739

Rse

0.0

Rst

3.01071819636e-07

Rsv

-0.99999999124


Height range @ 1km [m]

272

Height range @ 2km [m]

329

Height range @ 5km [m]

552

Height range @ 10km [m]

-999

Height range @ 20km [m]

-999


Variance slope @ 1 km

7042

Variance slope @ 2 km

4816

Variance slope @ 5 km

4632

Variance slope @ 10 km

-999

Variance slope @ 20 km

-999


NDVI (max. NDVI composite)


Roman et al. (2009) index


St

1.65164510204

Rcv

0.87768169132

Rse

0.0

Rst

-3.98656214367e-07

Rsv

-0.938688749192


NDVI range @ 1km [-]

0.0

NDVI range @ 2km [-]

0.03

NDVI range @ 5km [-]

0.13

NDVI range @ 10km [-]

0.27

NDVI range @ 20km [-]

0.3


Variance slope @ 1 km

0.0001194067194

Variance slope @ 2 km

0.000224168941238

Variance slope @ 5 km

0.000391949896533

Variance slope @ 10 km

0.000614985728008

Variance slope @ 20 km

0.00079217385796


NDVI (min. NDVI composite)I


Roman et al. (2009) index


St

0.573969920347

Rcv

0.829576270998

Rse

0.0

Rst

1.54588557717e-08

Rsv

4.39717845042


NDVI range @ 1km [-]

0.01

NDVI range @ 2km [-]

0.03

NDVI range @ 5km [-]

0.09

NDVI range @ 10km [-]

0.17

NDVI range @ 20km [-]

0.19


NDVI slope @ 1 km

6.05312436538e-05

NDVI slope @ 2 km

0.000104614775699

NDVI slope @ 5 km

0.000166563380512

NDVI slope @ 10 km

0.000244766160062

NDVI slope @ 20 km

0.00029762865714


Temporal stability analysis

+000 deg (BHR)


BHR statistics

Temporal stability [1/decade]:


abs

rel


Weighted least square:

None


Ordinary least square:

None


Probabilities that GCOS criteria is met:

Weighted least square:

None %

Ordinary least square:

None %


DHR statistics

Temporal stability [1/decade]:


abs

rel


Weighted least square:

None


Ordinary least square:

None


Probabilities that GCOS criteria is met:

Weighted least square:

None %

Ordinary least square:

None %


+057/+063 deg (BHR)


BHR statistics

Temporal stability [1/decade]:


abs

rel


Weighted least square:

None


Ordinary least square:

None


Probabilities that GCOS criteria is met:

Weighted least square:

None %

Ordinary least square:

None %


DHR statistics

Temporal stability [1/decade]:


abs

rel


Weighted least square:

None


Ordinary least square:

None


Probabilities that GCOS criteria is met:

Weighted least square:

None %

Ordinary least square:

None %


Temporal anomaly analyis

The variance of the temporal anomalies provides an additional measure about the stability of the signal AFTER removal of the mean seasonal cylce.

+000 deg


+057/+063 deg