MON_PIN


Location

lon / lat [deg]: 99.045 / 19.933

Source network: AERONET


Geostationary surface albedo (GSA) data


“+000”


“+057/+063”


Landcover information (based on ESA CCI landcover data)


Landcover fractions @ 2km distance


Landcover fractions @ 20 km distance


Legend


Distance to open water bodies [km]:

23.42

Distance to urban areas [km]:

13.39


Radius: 1 km

Number of landcover classes:

5

Dominant landcover type:

70: Tree cover, needleleaved, evergreen, closed to open (>15%)

Fraction of dominant landcover type [%]:

37.0


Radius: 2 km

Number of landcover classes:

5

Dominant landcover type:

70: Tree cover, needleleaved, evergreen, closed to open (>15%)

Fraction of dominant landcover type [%]:

47.0


Radius: 5 km

Number of landcover classes:

6

Dominant landcover type:

70: Tree cover, needleleaved, evergreen, closed to open (>15%)

Fraction of dominant landcover type [%]:

43.0


Radius: 10 km

Number of landcover classes:

7

Dominant landcover type:

70: Tree cover, needleleaved, evergreen, closed to open (>15%)

Fraction of dominant landcover type [%]:

29.0


Radius: 20 km

Number of landcover classes:

7

Dominant landcover type:

70: Tree cover, needleleaved, evergreen, closed to open (>15%)

Fraction of dominant landcover type [%]:

23.0


Disturbances


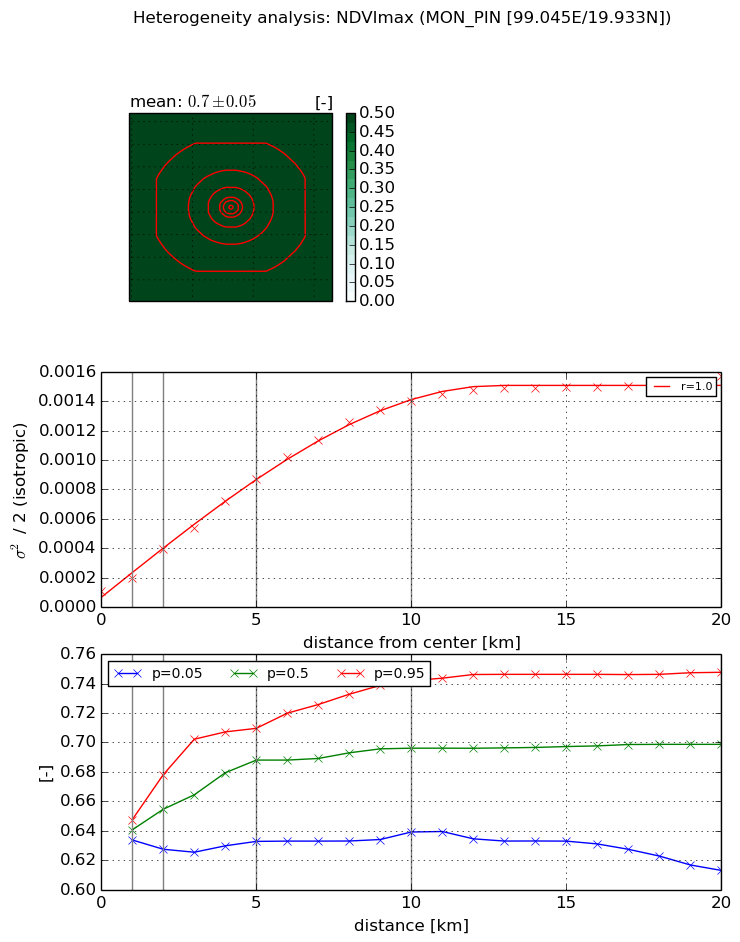
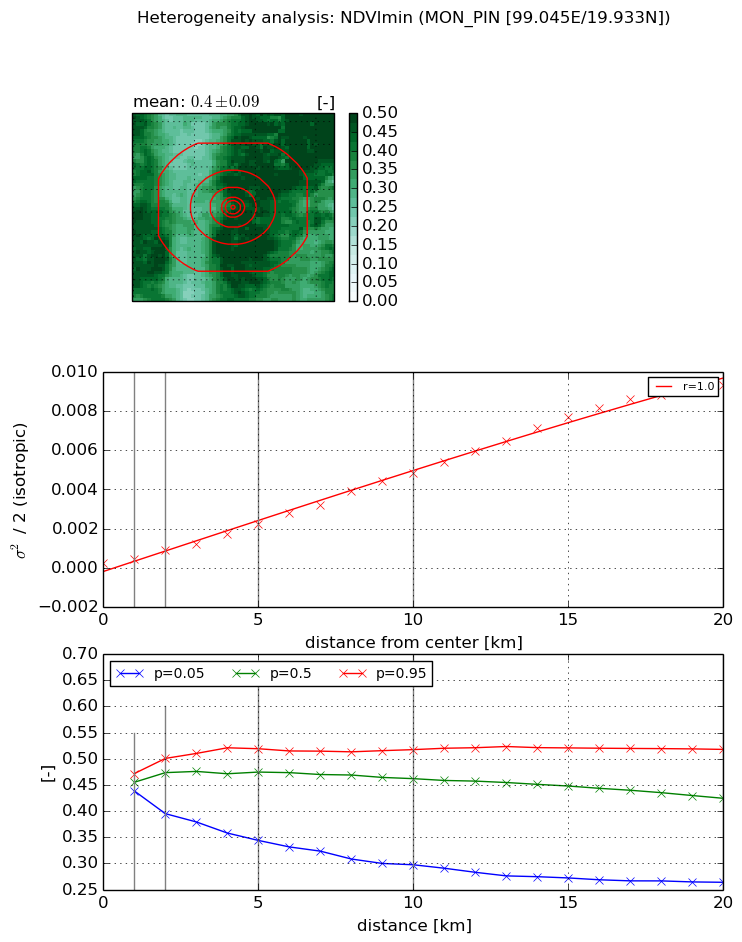
Heterogeneity analysis

The heterogeneity analysis provides information about the spatial and temporal heterogeneity of the site.

Topography


Roman et al. (2009) index


St

2.95049750468

Rcv

0.381818327651

Rse

0.0

Rst

-2.63054697244e-07

Rsv

-0.634959086699


Height range @ 1km [m]

210

Height range @ 2km [m]

490

Height range @ 5km [m]

843

Height range @ 10km [m]

-999

Height range @ 20km [m]

-999


Variance slope @ 1 km

16148

Variance slope @ 2 km

16460

Variance slope @ 5 km

19490

Variance slope @ 10 km

-999

Variance slope @ 20 km

-999


NDVI (max. NDVI composite)


Roman et al. (2009) index


St

27.9603838067

Rcv

-0.0483759584993

Rse

0.0

Rst

-0.00973582985342

Rsv

-0.0491828761533


NDVI range @ 1km [-]

0.01

NDVI range @ 2km [-]

0.05

NDVI range @ 5km [-]

0.08

NDVI range @ 10km [-]

0.1

NDVI range @ 20km [-]

0.13


Variance slope @ 1 km

8.91422828402e-05

Variance slope @ 2 km

0.000140872401576

Variance slope @ 5 km

0.000157177718479

Variance slope @ 10 km

0.000137574433424

Variance slope @ 20 km

6.95361070059e-05


NDVI (min. NDVI composite)I


Roman et al. (2009) index


St

4.45712313976e-07

Rcv

0.277811684047

Rse

0.0

Rst

0.257217223867

Rsv

6730798.47125


NDVI range @ 1km [-]

0.03

NDVI range @ 2km [-]

0.11

NDVI range @ 5km [-]

0.18

NDVI range @ 10km [-]

0.22

NDVI range @ 20km [-]

0.25


NDVI slope @ 1 km

0.000191486092235

NDVI slope @ 2 km

0.000318805963686

NDVI slope @ 5 km

0.000403906793014

NDVI slope @ 10 km

0.000481431324927

NDVI slope @ 20 km

0.000495915476809


Temporal stability analysis

+000 deg (BHR)


BHR statistics

Temporal stability [1/decade]:


abs

rel


Weighted least square:

None


Ordinary least square:

None


Probabilities that GCOS criteria is met:

Weighted least square:

None %

Ordinary least square:

None %


DHR statistics

Temporal stability [1/decade]:


abs

rel


Weighted least square:

None


Ordinary least square:

None


Probabilities that GCOS criteria is met:

Weighted least square:

None %

Ordinary least square:

None %


+057/+063 deg (BHR)


BHR statistics

Temporal stability [1/decade]:


abs

rel


Weighted least square:

-0.0136543014006


Ordinary least square:

0.0085284236197


Probabilities that GCOS criteria is met:

Weighted least square:

3.3 %

Ordinary least square:

4.7 %


DHR statistics

Temporal stability [1/decade]:


abs

rel


Weighted least square:

-0.0105827863741


Ordinary least square:

0.00675074121937


Probabilities that GCOS criteria is met:

Weighted least square:

3.3 %

Ordinary least square:

4.7 %


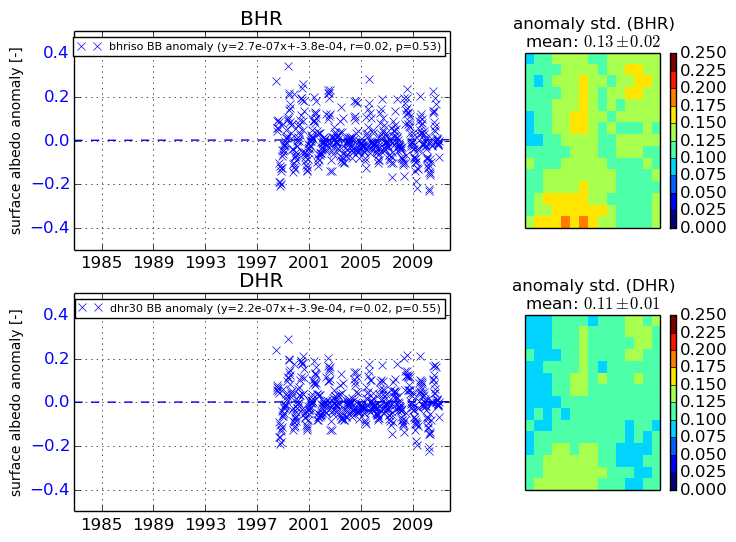
Temporal anomaly analyis

The variance of the temporal anomalies provides an additional measure about the stability of the signal AFTER removal of the mean seasonal cylce.

+000 deg


+057/+063 deg