MOUNT_GIBBES


Location

lon / lat [deg]: -82.293 / 35.783

Source network: AERONET


Geostationary surface albedo (GSA) data


“+000”


“+057/+063”


Landcover information (based on ESA CCI landcover data)


Landcover fractions @ 2km distance


Landcover fractions @ 20 km distance


Legend


Distance to open water bodies [km]:

6.11

Distance to urban areas [km]:

4.79


Radius: 1 km

Number of landcover classes:

2

Dominant landcover type:

60: Tree cover, broadleaved, decidous

Fraction of dominant landcover type [%]:

76.0


Radius: 2 km

Number of landcover classes:

3

Dominant landcover type:

60: Tree cover, broadleaved, decidous

Fraction of dominant landcover type [%]:

80.0


Radius: 5 km

Number of landcover classes:

3

Dominant landcover type:

60: Tree cover, broadleaved, decidous

Fraction of dominant landcover type [%]:

88.0


Radius: 10 km

Number of landcover classes:

3

Dominant landcover type:

60: Tree cover, broadleaved, decidous

Fraction of dominant landcover type [%]:

86.0


Radius: 20 km

Number of landcover classes:

4

Dominant landcover type:

60: Tree cover, broadleaved, decidous

Fraction of dominant landcover type [%]:

70.0


Disturbances


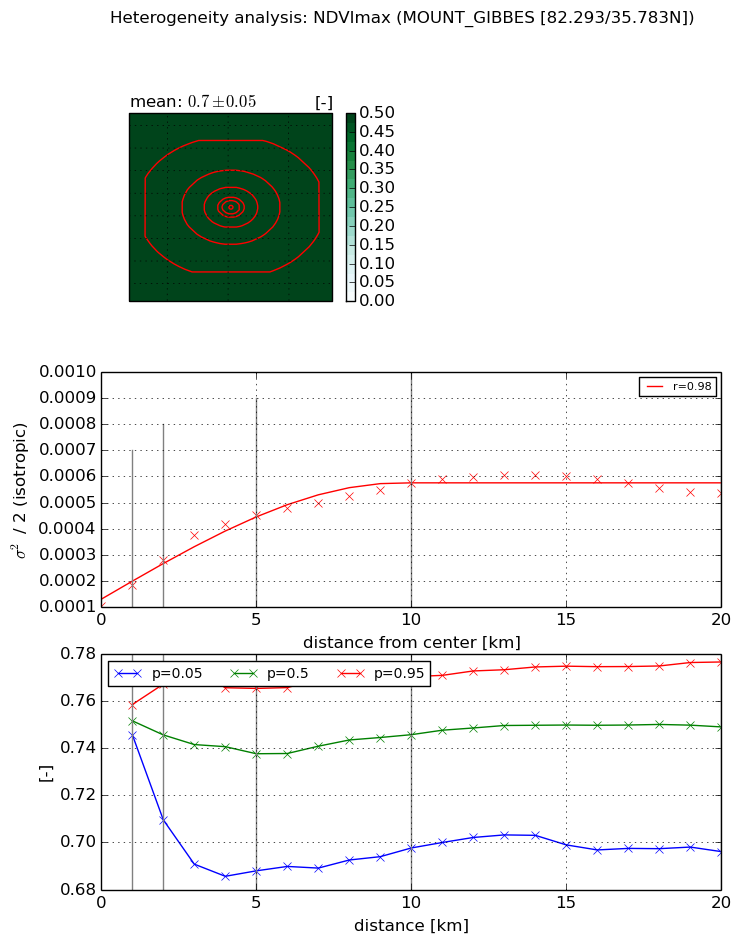
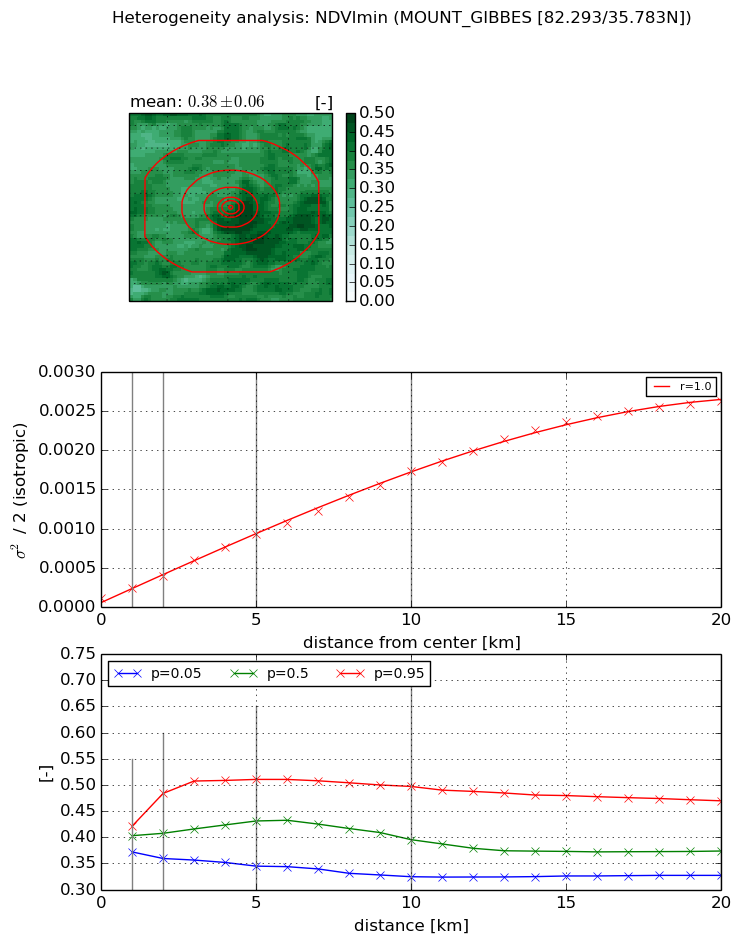
Heterogeneity analysis

The heterogeneity analysis provides information about the spatial and temporal heterogeneity of the site.

Topography


Roman et al. (2009) index


St

1.24438417644e-07

Rcv

-0.0151439559183

Rse

0.0

Rst

0.0153376711255

Rsv

24108310.3835


Height range @ 1km [m]

341

Height range @ 2km [m]

572

Height range @ 5km [m]

842

Height range @ 10km [m]

-999

Height range @ 20km [m]

-999


Variance slope @ 1 km

19551

Variance slope @ 2 km

21568

Variance slope @ 5 km

14326

Variance slope @ 10 km

-999

Variance slope @ 20 km

-999


NDVI (max. NDVI composite)


Roman et al. (2009) index


St

6.97777950912e-08

Rcv

-0.0236584432507

Rse

0.0

Rst

0.262451729027

Rsv

42993619.6195


NDVI range @ 1km [-]

0.01

NDVI range @ 2km [-]

0.06

NDVI range @ 5km [-]

0.08

NDVI range @ 10km [-]

0.07

NDVI range @ 20km [-]

0.08


Variance slope @ 1 km

8.33625542454e-05

Variance slope @ 2 km

8.79897239322e-05

Variance slope @ 5 km

7.2867921288e-05

Variance slope @ 10 km

4.42851833637e-05

Variance slope @ 20 km

1.81074617694e-05


NDVI (min. NDVI composite)I


Roman et al. (2009) index


St

3.2991756163

Rcv

0.0633935672379

Rse

0.0

Rst

-6.59429686441e-08

Rsv

-0.845924435606


NDVI range @ 1km [-]

0.05

NDVI range @ 2km [-]

0.12

NDVI range @ 5km [-]

0.17

NDVI range @ 10km [-]

0.17

NDVI range @ 20km [-]

0.14


NDVI slope @ 1 km

0.000132014027864

NDVI slope @ 2 km

0.000142113785661

NDVI slope @ 5 km

0.000167874654668

NDVI slope @ 10 km

0.000163018919326

NDVI slope @ 20 km

0.000133739042461


Temporal stability analysis

+000 deg (BHR)


BHR statistics

Temporal stability [1/decade]:


abs

rel


Weighted least square:

None


Ordinary least square:

None


Probabilities that GCOS criteria is met:

Weighted least square:

None %

Ordinary least square:

None %


DHR statistics

Temporal stability [1/decade]:


abs

rel


Weighted least square:

None


Ordinary least square:

None


Probabilities that GCOS criteria is met:

Weighted least square:

None %

Ordinary least square:

None %


+057/+063 deg (BHR)


BHR statistics

Temporal stability [1/decade]:


abs

rel


Weighted least square:

None


Ordinary least square:

None


Probabilities that GCOS criteria is met:

Weighted least square:

None %

Ordinary least square:

None %


DHR statistics

Temporal stability [1/decade]:


abs

rel


Weighted least square:

None


Ordinary least square:

None


Probabilities that GCOS criteria is met:

Weighted least square:

None %

Ordinary least square:

None %


Temporal anomaly analyis

The variance of the temporal anomalies provides an additional measure about the stability of the signal AFTER removal of the mean seasonal cylce.

+000 deg


+057/+063 deg