MUNICH_MAISACH


Location

lon / lat [deg]: 11.258 / 48.209

Source network: AERONET


Geostationary surface albedo (GSA) data


“+000”


“+057/+063”


Landcover information (based on ESA CCI landcover data)


Landcover fractions @ 2km distance


Landcover fractions @ 20 km distance


Legend


Distance to open water bodies [km]:

11.58

Distance to urban areas [km]:

0.15


Radius: 1 km

Number of landcover classes:

2

Dominant landcover type:

190: urban areas

Fraction of dominant landcover type [%]:

94.0


Radius: 2 km

Number of landcover classes:

2

Dominant landcover type:

190: urban areas

Fraction of dominant landcover type [%]:

65.0


Radius: 5 km

Number of landcover classes:

4

Dominant landcover type:

10: cropland, rainfed

Fraction of dominant landcover type [%]:

50.0


Radius: 10 km

Number of landcover classes:

6

Dominant landcover type:

10: cropland, rainfed

Fraction of dominant landcover type [%]:

57.0


Radius: 20 km

Number of landcover classes:

5

Dominant landcover type:

10: cropland, rainfed

Fraction of dominant landcover type [%]:

52.0


Disturbances


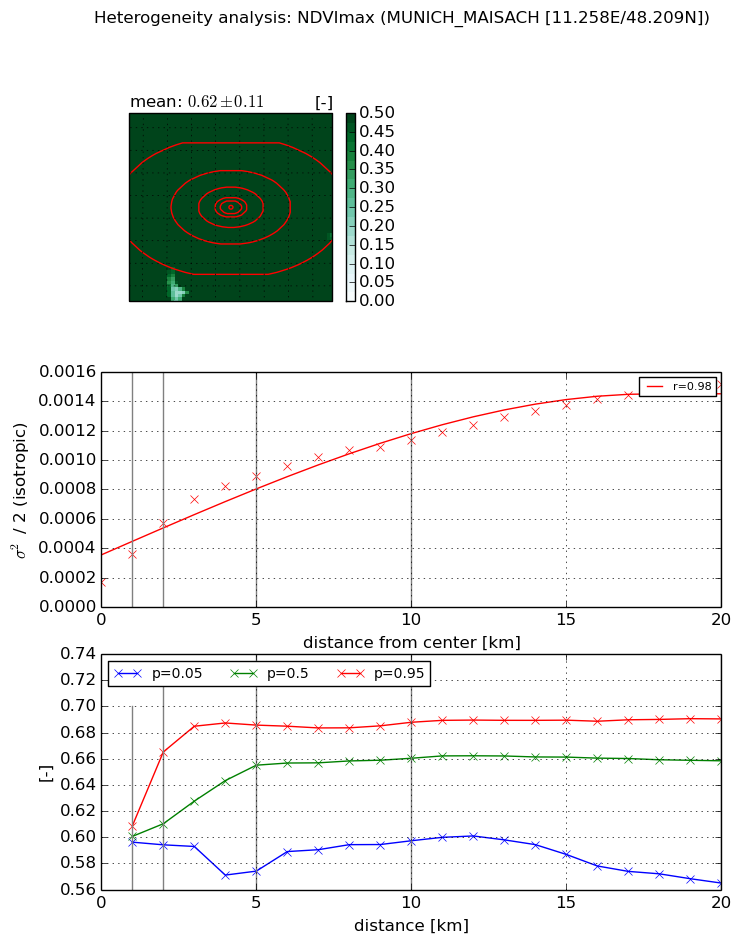
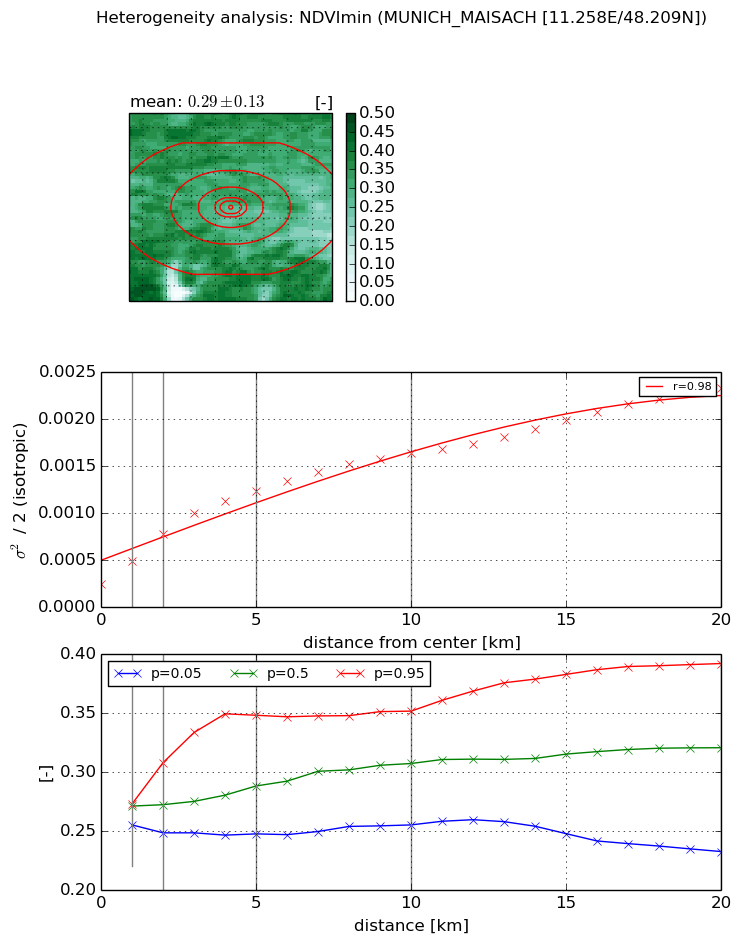
Heterogeneity analysis

The heterogeneity analysis provides information about the spatial and temporal heterogeneity of the site.

Topography


Roman et al. (2009) index


St

1.72470503098

Rcv

1.16119865405

Rse

0.0

Rst

-1.70616783012e-08

Rsv

-0.578229199812


Height range @ 1km [m]

8

Height range @ 2km [m]

17

Height range @ 5km [m]

49

Height range @ 10km [m]

-999

Height range @ 20km [m]

-999


Variance slope @ 1 km

90

Variance slope @ 2 km

72

Variance slope @ 5 km

50

Variance slope @ 10 km

-999

Variance slope @ 20 km

-999


NDVI (max. NDVI composite)


Roman et al. (2009) index


St

0.000312364793165

Rcv

0.00598291258063

Rse

0.0

Rst

0.239201476416

Rsv

9603.91016743


NDVI range @ 1km [-]

0.01

NDVI range @ 2km [-]

0.07

NDVI range @ 5km [-]

0.11

NDVI range @ 10km [-]

0.09

NDVI range @ 20km [-]

0.13


Variance slope @ 1 km

0.000186646225668

Variance slope @ 2 km

0.000199412501543

Variance slope @ 5 km

0.000147330041479

Variance slope @ 10 km

9.00277205727e-05

Variance slope @ 20 km

5.74636933047e-05


NDVI (min. NDVI composite)I


Roman et al. (2009) index


St

1.72022279945e-07

Rcv

0.112771148427

Rse

0.0

Rst

0.169671661026

Rsv

17439601.1515


NDVI range @ 1km [-]

0.02

NDVI range @ 2km [-]

0.06

NDVI range @ 5km [-]

0.1

NDVI range @ 10km [-]

0.1

NDVI range @ 20km [-]

0.16


NDVI slope @ 1 km

0.000250796878255

NDVI slope @ 2 km

0.000266112089172

NDVI slope @ 5 km

0.000203336752759

NDVI slope @ 10 km

0.000132807625666

NDVI slope @ 20 km

9.0672053295e-05


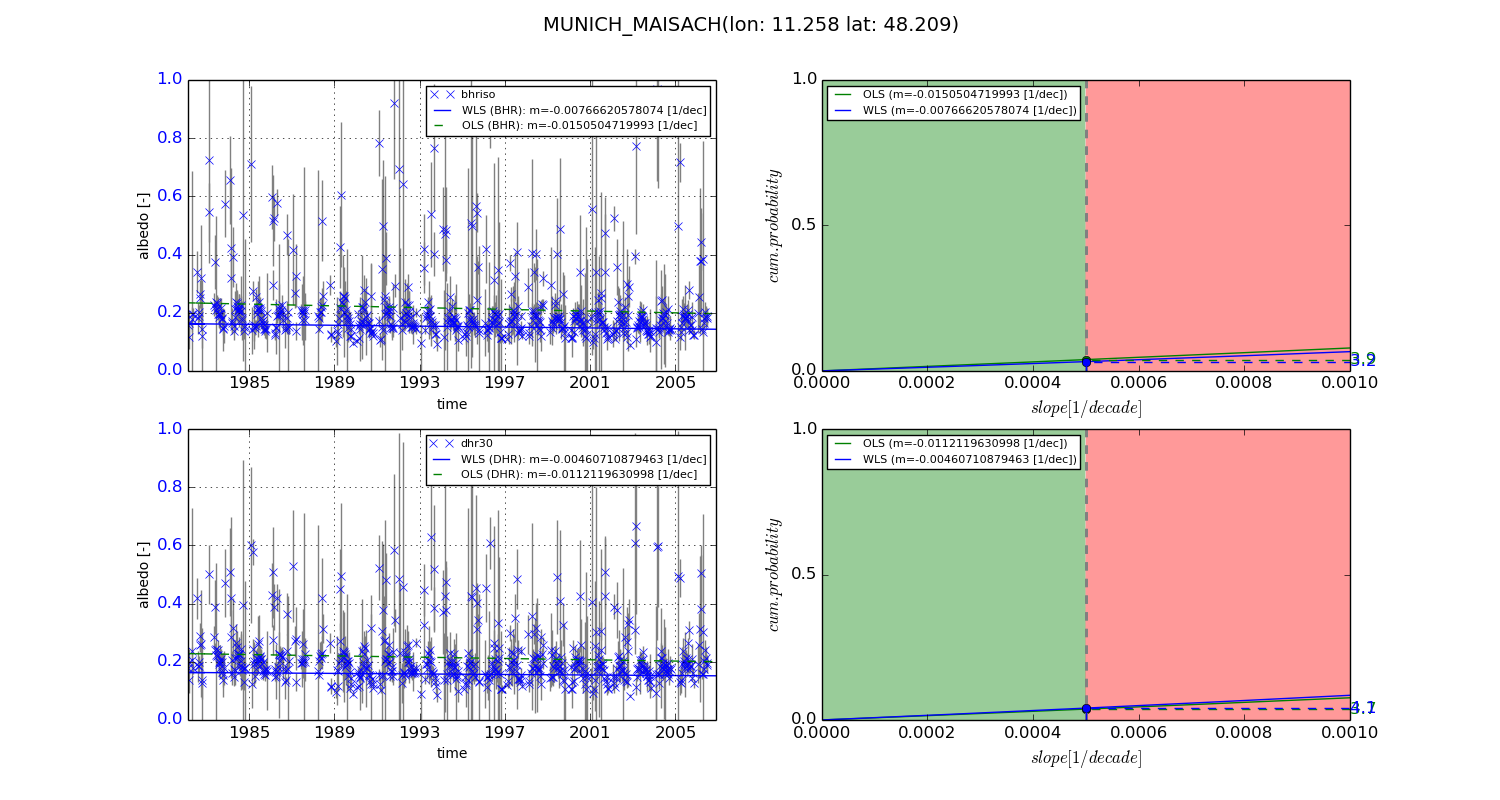
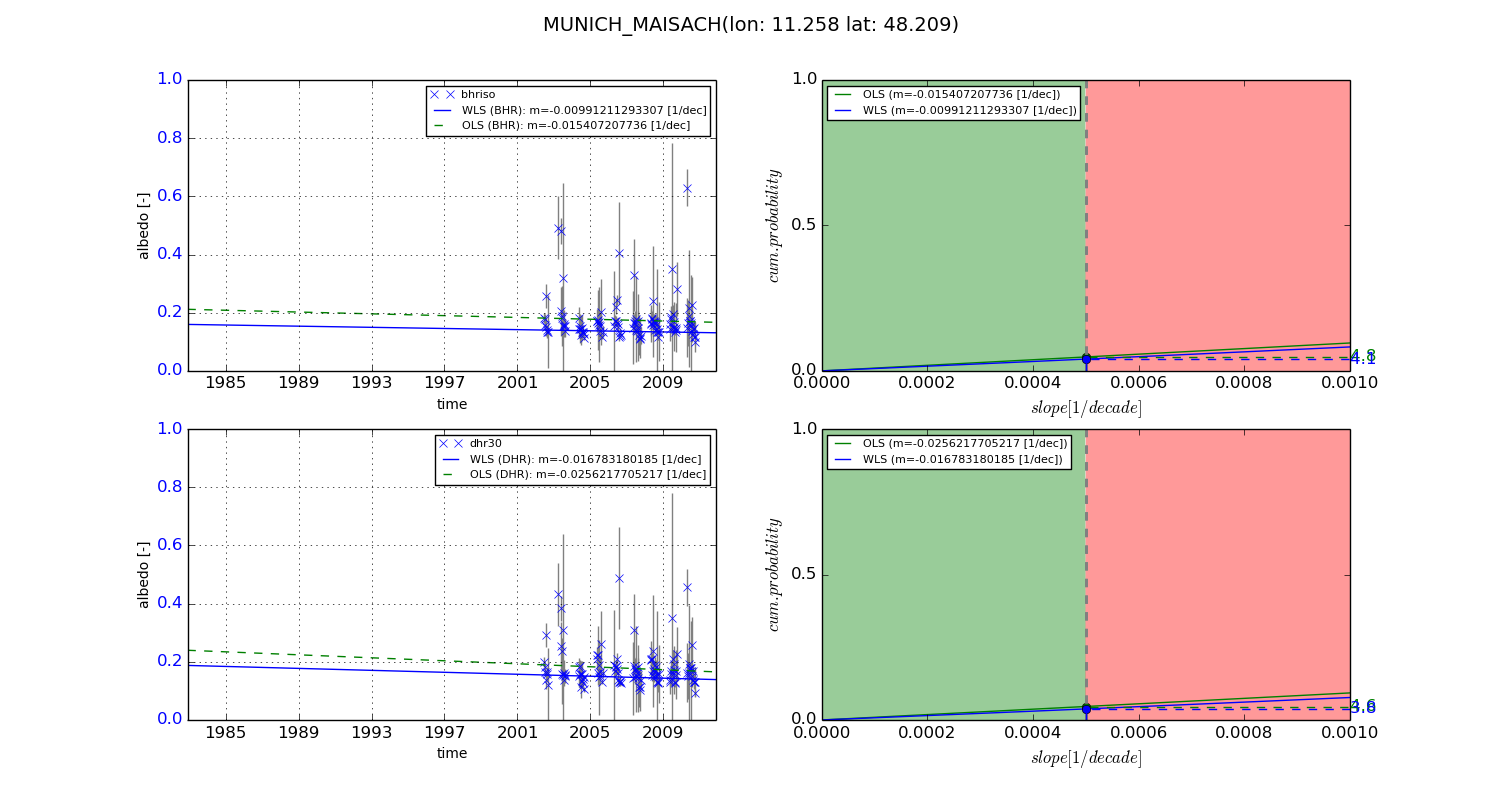
Temporal stability analysis

+000 deg (BHR)


BHR statistics

Temporal stability [1/decade]:


abs

rel


Weighted least square:

-0.00766620578074


Ordinary least square:

-0.0150504719993


Probabilities that GCOS criteria is met:

Weighted least square:

3.2 %

Ordinary least square:

3.9 %


DHR statistics

Temporal stability [1/decade]:


abs

rel


Weighted least square:

-0.00460710879463


Ordinary least square:

-0.0112119630998


Probabilities that GCOS criteria is met:

Weighted least square:

4.1 %

Ordinary least square:

3.7 %


+057/+063 deg (BHR)


BHR statistics

Temporal stability [1/decade]:


abs

rel


Weighted least square:

-0.00991211293307


Ordinary least square:

-0.015407207736


Probabilities that GCOS criteria is met:

Weighted least square:

4.1 %

Ordinary least square:

4.8 %


DHR statistics

Temporal stability [1/decade]:


abs

rel


Weighted least square:

-0.016783180185


Ordinary least square:

-0.0256217705217


Probabilities that GCOS criteria is met:

Weighted least square:

3.8 %

Ordinary least square:

4.6 %


Temporal anomaly analyis

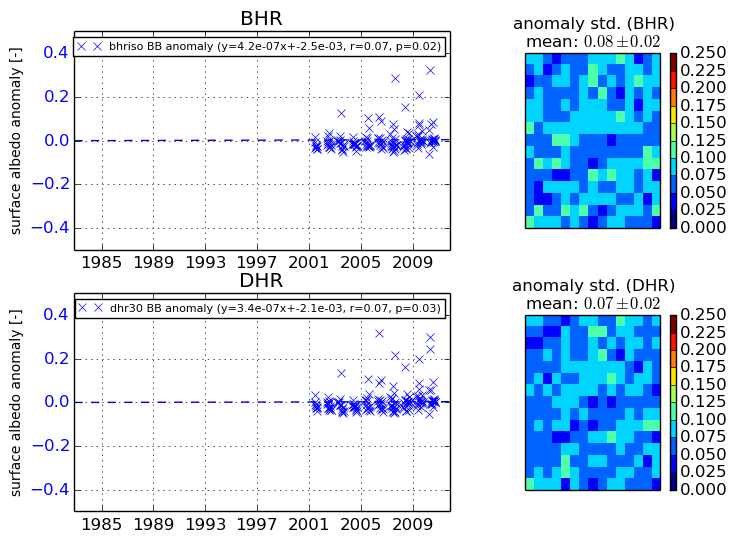
The variance of the temporal anomalies provides an additional measure about the stability of the signal AFTER removal of the mean seasonal cylce.
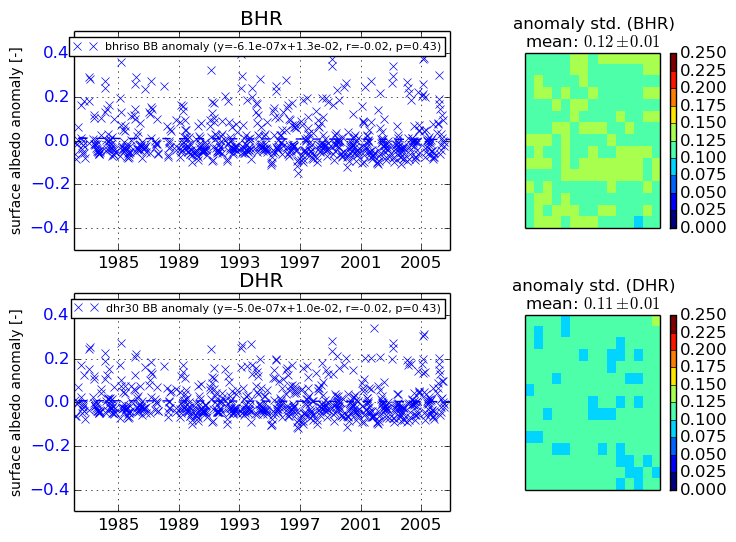
+000 deg


+057/+063 deg