NEON_GRANDJUNCTION


Location

lon / lat [deg]: -108.5355 / 39.1271

Source network: AERONET


Geostationary surface albedo (GSA) data


“+000”


“+057/+063”


Landcover information (based on ESA CCI landcover data)


Landcover fractions @ 2km distance


Landcover fractions @ 20 km distance


Legend


Distance to open water bodies [km]:

7.7

Distance to urban areas [km]:

0.1


Radius: 1 km

Number of landcover classes:

2

Dominant landcover type:

190: urban areas

Fraction of dominant landcover type [%]:

51.0


Radius: 2 km

Number of landcover classes:

3

Dominant landcover type:

120: Shrubland

Fraction of dominant landcover type [%]:

57.0


Radius: 5 km

Number of landcover classes:

4

Dominant landcover type:

120: Shrubland

Fraction of dominant landcover type [%]:

55.0


Radius: 10 km

Number of landcover classes:

5

Dominant landcover type:

120: Shrubland

Fraction of dominant landcover type [%]:

49.0


Radius: 20 km

Number of landcover classes:

5

Dominant landcover type:

120: Shrubland

Fraction of dominant landcover type [%]:

63.0


Disturbances


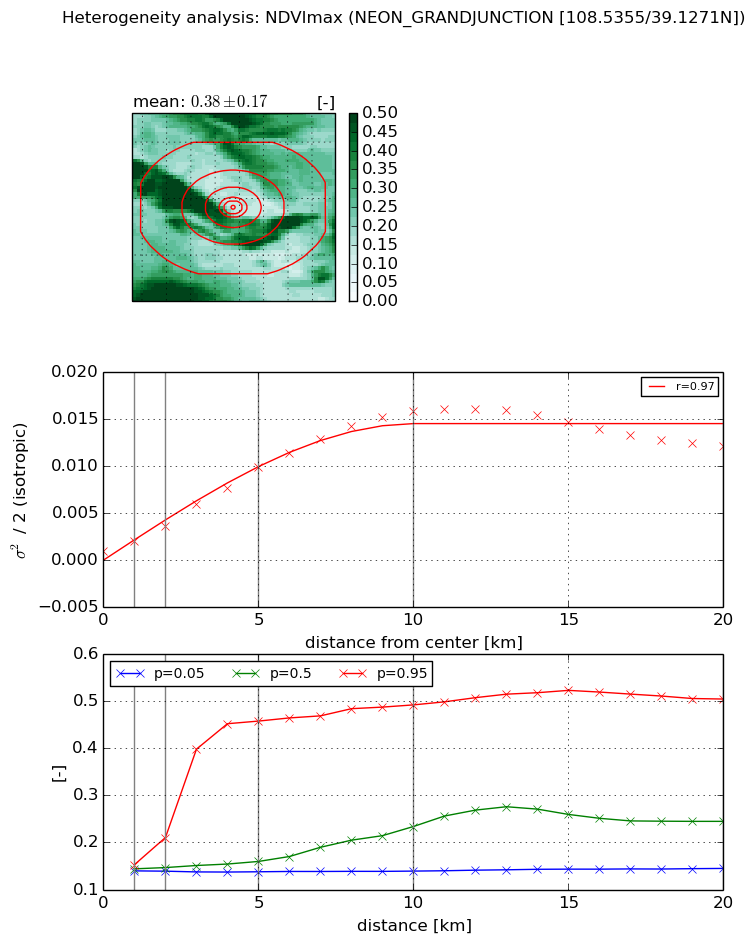
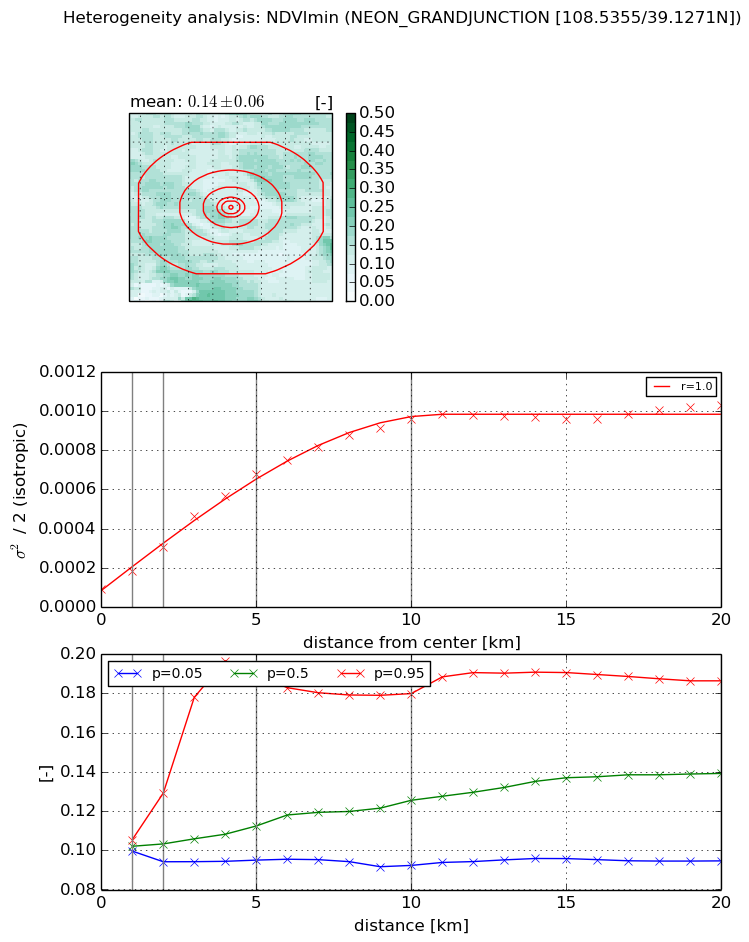
Heterogeneity analysis

The heterogeneity analysis provides information about the spatial and temporal heterogeneity of the site.

Topography


Roman et al. (2009) index


St

2.10976276857

Rcv

0.574158609036

Rse

0.0

Rst

-2.07128918152e-06

Rsv

-0.84780014138


Height range @ 1km [m]

37

Height range @ 2km [m]

64

Height range @ 5km [m]

128

Height range @ 10km [m]

-999

Height range @ 20km [m]

-999


Variance slope @ 1 km

115

Variance slope @ 2 km

170

Variance slope @ 5 km

355

Variance slope @ 10 km

-999

Variance slope @ 20 km

-999


NDVI (max. NDVI composite)


Roman et al. (2009) index


St

3.0107207342e-06

Rcv

0.143360759878

Rse

0.0

Rst

0.137615054873

Rsv

996438.865945


NDVI range @ 1km [-]

0.01

NDVI range @ 2km [-]

0.07

NDVI range @ 5km [-]

0.32

NDVI range @ 10km [-]

0.35

NDVI range @ 20km [-]

0.36


Variance slope @ 1 km

0.00111020348591

Variance slope @ 2 km

0.00134216327528

Variance slope @ 5 km

0.00183647484144

Variance slope @ 10 km

0.00160780432267

Variance slope @ 20 km

0.000547436274284


NDVI (min. NDVI composite)I


Roman et al. (2009) index


St

1.45161211386

Rcv

0.0611564186794

Rse

0.0

Rst

0.130817256553

Rsv

1.87469411525


NDVI range @ 1km [-]

0.01

NDVI range @ 2km [-]

0.04

NDVI range @ 5km [-]

0.09

NDVI range @ 10km [-]

0.09

NDVI range @ 20km [-]

0.09


NDVI slope @ 1 km

9.52943863105e-05

NDVI slope @ 2 km

0.000107911183094

NDVI slope @ 5 km

0.000121218631344

NDVI slope @ 10 km

8.96923036733e-05

NDVI slope @ 20 km

4.09241607089e-05


Temporal stability analysis

+000 deg (BHR)


BHR statistics

Temporal stability [1/decade]:


abs

rel


Weighted least square:

None


Ordinary least square:

None


Probabilities that GCOS criteria is met:

Weighted least square:

None %

Ordinary least square:

None %


DHR statistics

Temporal stability [1/decade]:


abs

rel


Weighted least square:

None


Ordinary least square:

None


Probabilities that GCOS criteria is met:

Weighted least square:

None %

Ordinary least square:

None %


+057/+063 deg (BHR)


BHR statistics

Temporal stability [1/decade]:


abs

rel


Weighted least square:

None


Ordinary least square:

None


Probabilities that GCOS criteria is met:

Weighted least square:

None %

Ordinary least square:

None %


DHR statistics

Temporal stability [1/decade]:


abs

rel


Weighted least square:

None


Ordinary least square:

None


Probabilities that GCOS criteria is met:

Weighted least square:

None %

Ordinary least square:

None %


Temporal anomaly analyis

The variance of the temporal anomalies provides an additional measure about the stability of the signal AFTER removal of the mean seasonal cylce.

+000 deg


+057/+063 deg