NEW_DELHI


Location

lon / lat [deg]: 77.1751 / 28.6305

Source network: AERONET


Geostationary surface albedo (GSA) data


“+000”


“+057/+063”


Landcover information (based on ESA CCI landcover data)


Landcover fractions @ 2km distance


Landcover fractions @ 20 km distance


Legend


Distance to open water bodies [km]:

7.56

Distance to urban areas [km]:

0.19


Radius: 1 km

Number of landcover classes:

1

Dominant landcover type:

190: urban areas

Fraction of dominant landcover type [%]:

100.0


Radius: 2 km

Number of landcover classes:

1

Dominant landcover type:

190: urban areas

Fraction of dominant landcover type [%]:

100.0


Radius: 5 km

Number of landcover classes:

1

Dominant landcover type:

190: urban areas

Fraction of dominant landcover type [%]:

100.0


Radius: 10 km

Number of landcover classes:

1

Dominant landcover type:

190: urban areas

Fraction of dominant landcover type [%]:

99.0


Radius: 20 km

Number of landcover classes:

6

Dominant landcover type:

190: urban areas

Fraction of dominant landcover type [%]:

81.0


Disturbances


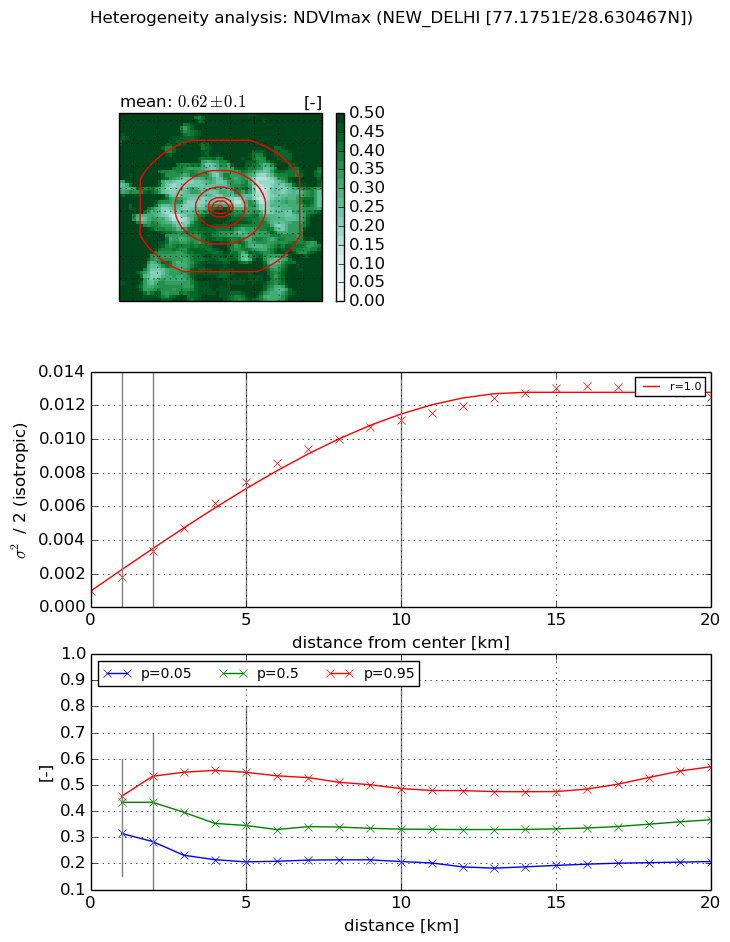
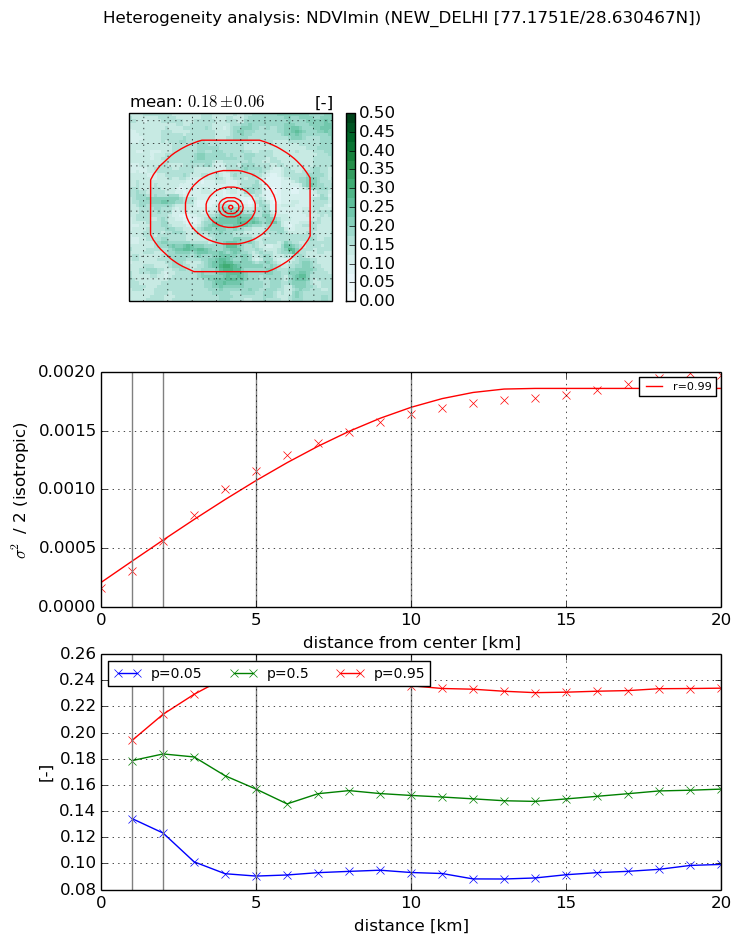
Heterogeneity analysis

The heterogeneity analysis provides information about the spatial and temporal heterogeneity of the site.

Topography


Roman et al. (2009) index


St

2.22907648347

Rcv

0.115270200598

Rse

0.0

Rst

-0.0527291370907

Rsv

1.17784950251


Height range @ 1km [m]

24

Height range @ 2km [m]

31

Height range @ 5km [m]

33

Height range @ 10km [m]

-999

Height range @ 20km [m]

-999


Variance slope @ 1 km

28

Variance slope @ 2 km

31

Variance slope @ 5 km

32

Variance slope @ 10 km

-999

Variance slope @ 20 km

-999


NDVI (max. NDVI composite)


Roman et al. (2009) index


St

4.15448836081

Rcv

0.176357451057

Rse

0.0

Rst

-0.0910352438004

Rsv

0.454717885184


NDVI range @ 1km [-]

0.14

NDVI range @ 2km [-]

0.25

NDVI range @ 5km [-]

0.34

NDVI range @ 10km [-]

0.28

NDVI range @ 20km [-]

0.36


Variance slope @ 1 km

0.000839232396601

Variance slope @ 2 km

0.00119403330259

Variance slope @ 5 km

0.00134655892161

Variance slope @ 10 km

0.00107891348425

Variance slope @ 20 km

0.00058503223716


NDVI (min. NDVI composite)I


Roman et al. (2009) index


St

1.82528561354

Rcv

0.371084025408

Rse

0.0

Rst

-0.272494755373

Rsv

-0.999999614699


NDVI range @ 1km [-]

0.06

NDVI range @ 2km [-]

0.09

NDVI range @ 5km [-]

0.16

NDVI range @ 10km [-]

0.14

NDVI range @ 20km [-]

0.13


NDVI slope @ 1 km

0.00014502629088

NDVI slope @ 2 km

0.000202305153022

NDVI slope @ 5 km

0.000208873281707

NDVI slope @ 10 km

0.000152179757917

NDVI slope @ 20 km

8.30491493716e-05


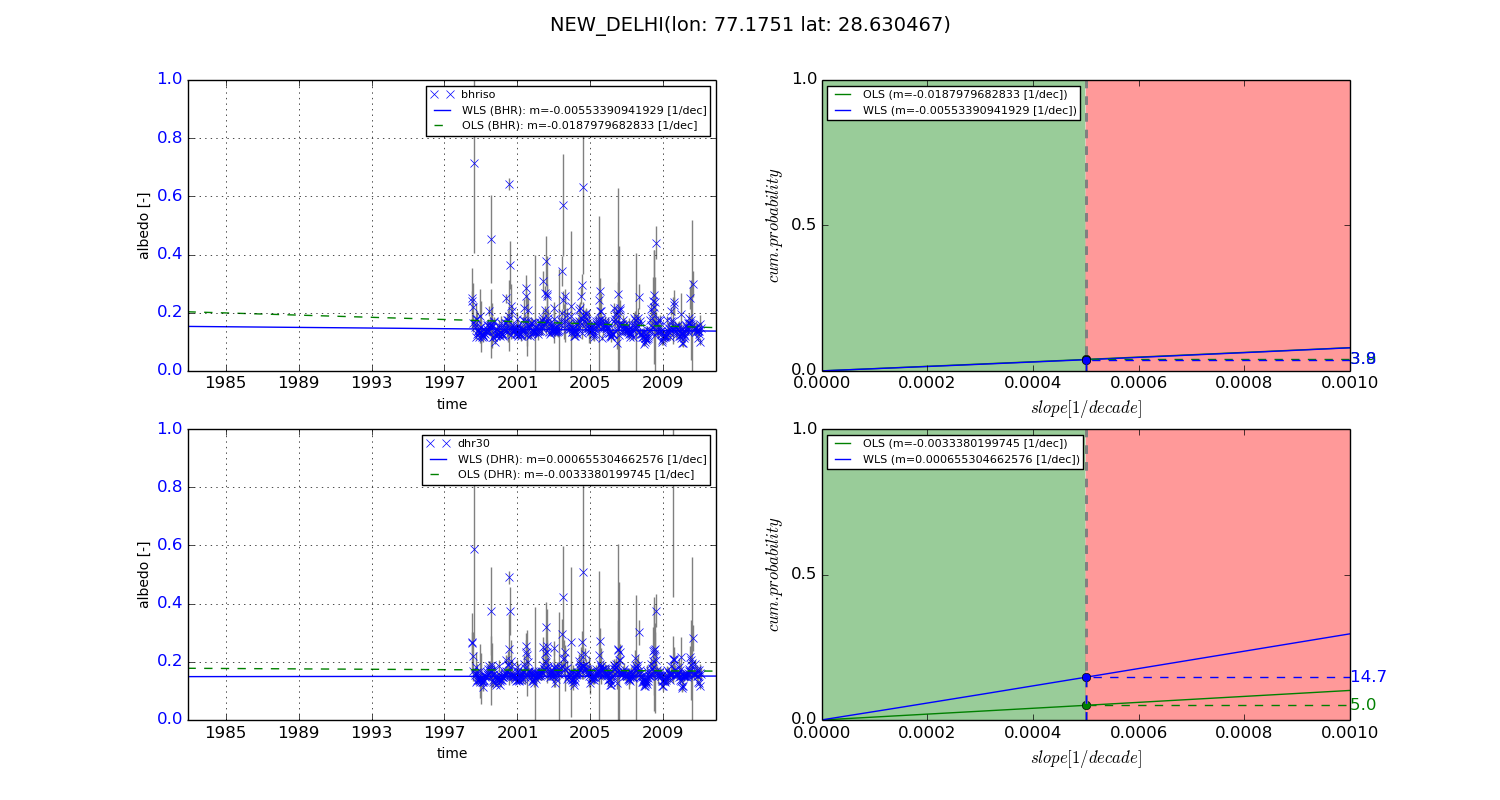
Temporal stability analysis

+000 deg (BHR)


BHR statistics

Temporal stability [1/decade]:


abs

rel


Weighted least square:

-99999.0


Ordinary least square:

-99999.0


Probabilities that GCOS criteria is met:

Weighted least square:

-99999.0 %

Ordinary least square:

-99999.0 %


DHR statistics

Temporal stability [1/decade]:


abs

rel


Weighted least square:

-99999.0


Ordinary least square:

-99999.0


Probabilities that GCOS criteria is met:

Weighted least square:

-99999.0 %

Ordinary least square:

-99999.0 %


+057/+063 deg (BHR)


BHR statistics

Temporal stability [1/decade]:


abs

rel


Weighted least square:

-0.00553390941929


Ordinary least square:

-0.0187979682833


Probabilities that GCOS criteria is met:

Weighted least square:

3.8 %

Ordinary least square:

3.9 %


DHR statistics

Temporal stability [1/decade]:


abs

rel


Weighted least square:

0.000655304662576


Ordinary least square:

-0.0033380199745


Probabilities that GCOS criteria is met:

Weighted least square:

14.7 %

Ordinary least square:

5.0 %


Temporal anomaly analyis

The variance of the temporal anomalies provides an additional measure about the stability of the signal AFTER removal of the mean seasonal cylce.

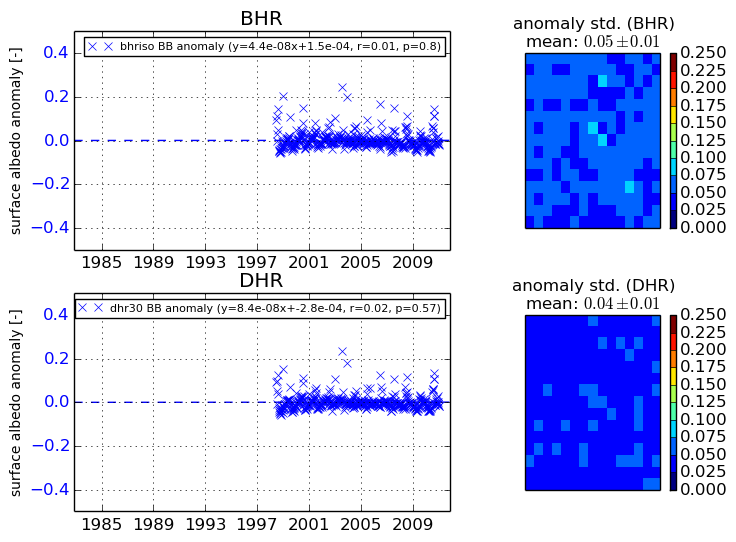
+000 deg


+057/+063 deg