NGHIA_DO


Location

lon / lat [deg]: 105.7996 / 21.0478

Source network: AERONET


Geostationary surface albedo (GSA) data


“+000”


“+057/+063”


Landcover information (based on ESA CCI landcover data)


Landcover fractions @ 2km distance


Landcover fractions @ 20 km distance


Legend


Distance to open water bodies [km]:

1.46

Distance to urban areas [km]:

0.28


Radius: 1 km

Number of landcover classes:

3

Dominant landcover type:

190: urban areas

Fraction of dominant landcover type [%]:

60.0


Radius: 2 km

Number of landcover classes:

4

Dominant landcover type:

190: urban areas

Fraction of dominant landcover type [%]:

63.0


Radius: 5 km

Number of landcover classes:

6

Dominant landcover type:

190: urban areas

Fraction of dominant landcover type [%]:

41.0


Radius: 10 km

Number of landcover classes:

6

Dominant landcover type:

10: cropland, rainfed

Fraction of dominant landcover type [%]:

36.0


Radius: 20 km

Number of landcover classes:

6

Dominant landcover type:

10: cropland, rainfed

Fraction of dominant landcover type [%]:

46.0


Disturbances


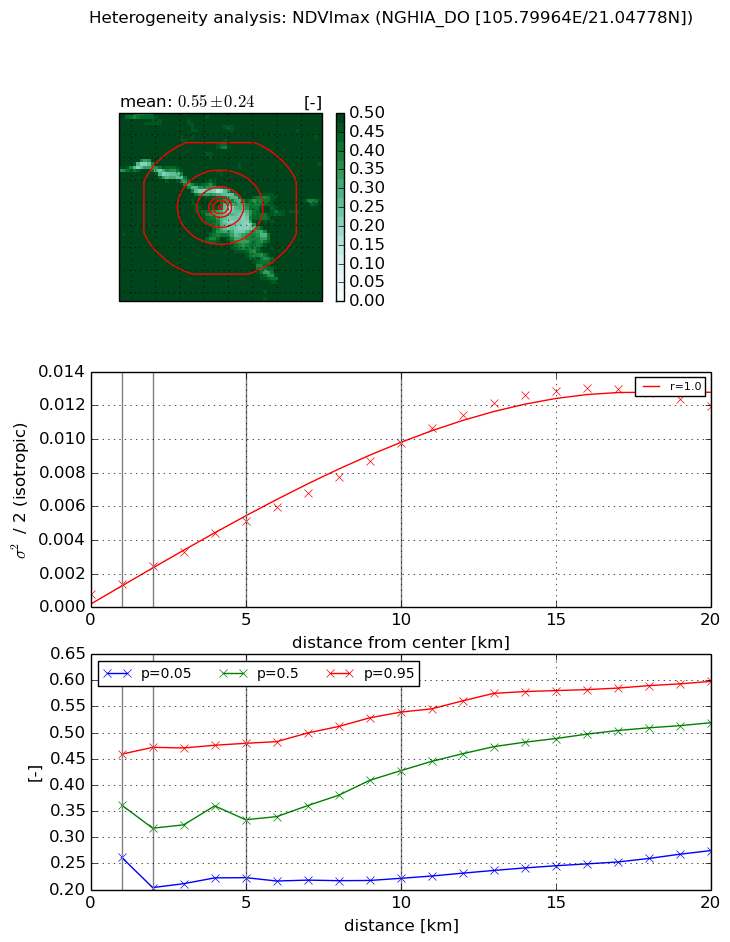
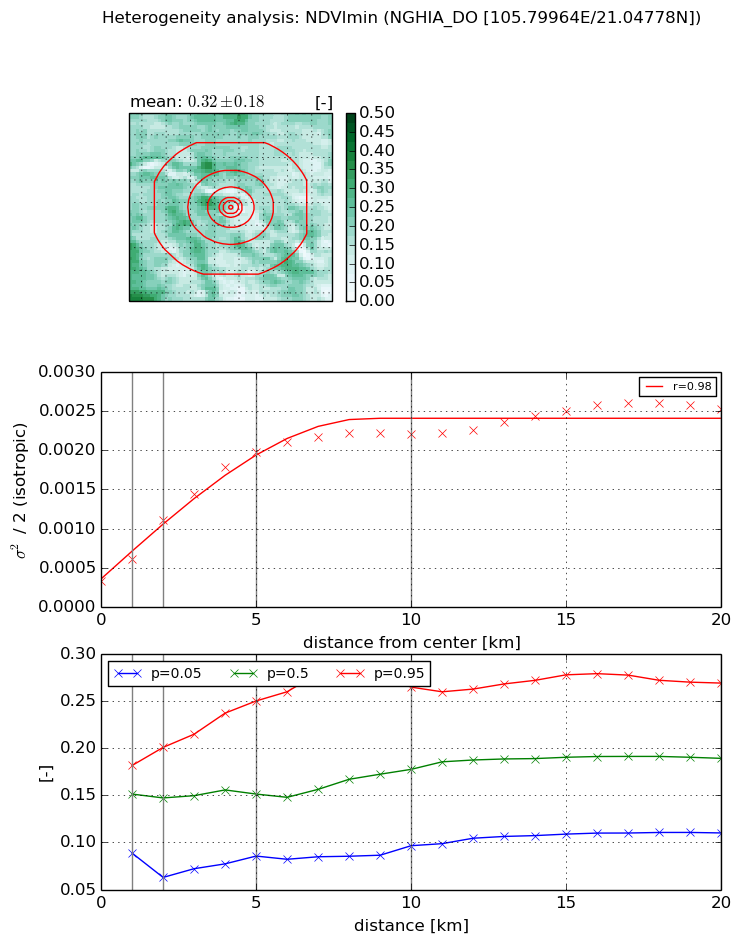
Heterogeneity analysis

The heterogeneity analysis provides information about the spatial and temporal heterogeneity of the site.

Topography


Roman et al. (2009) index


St

5.13278407692

Rcv

0.0727061251601

Rse

0.0

Rst

-0.295952645559

Rsv

0.215819351688


Height range @ 1km [m]

9

Height range @ 2km [m]

11

Height range @ 5km [m]

11

Height range @ 10km [m]

-999

Height range @ 20km [m]

-999


Variance slope @ 1 km

4

Variance slope @ 2 km

2

Variance slope @ 5 km

1

Variance slope @ 10 km

-999

Variance slope @ 20 km

-999


NDVI (max. NDVI composite)


Roman et al. (2009) index


St

4.66506131459

Rcv

-0.0126284038533

Rse

0.0

Rst

-0.241516040343

Rsv

0.388933920201


NDVI range @ 1km [-]

0.2

NDVI range @ 2km [-]

0.27

NDVI range @ 5km [-]

0.26

NDVI range @ 10km [-]

0.32

NDVI range @ 20km [-]

0.32


Variance slope @ 1 km

0.000634166858392

Variance slope @ 2 km

0.000855598187171

Variance slope @ 5 km

0.000908872289985

Variance slope @ 10 km

0.000898558282164

Variance slope @ 20 km

0.000653985705141


NDVI (min. NDVI composite)I


Roman et al. (2009) index


St

1.7248428601

Rcv

0.062331147053

Rse

0.0

Rst

-0.676957892573

Rsv

-0.999999836709


NDVI range @ 1km [-]

0.09

NDVI range @ 2km [-]

0.14

NDVI range @ 5km [-]

0.16

NDVI range @ 10km [-]

0.17

NDVI range @ 20km [-]

0.16


NDVI slope @ 1 km

0.000279936199272

NDVI slope @ 2 km

0.000386008477689

NDVI slope @ 5 km

0.000344506334318

NDVI slope @ 10 km

0.000189321434332

NDVI slope @ 20 km

8.94389422944e-05


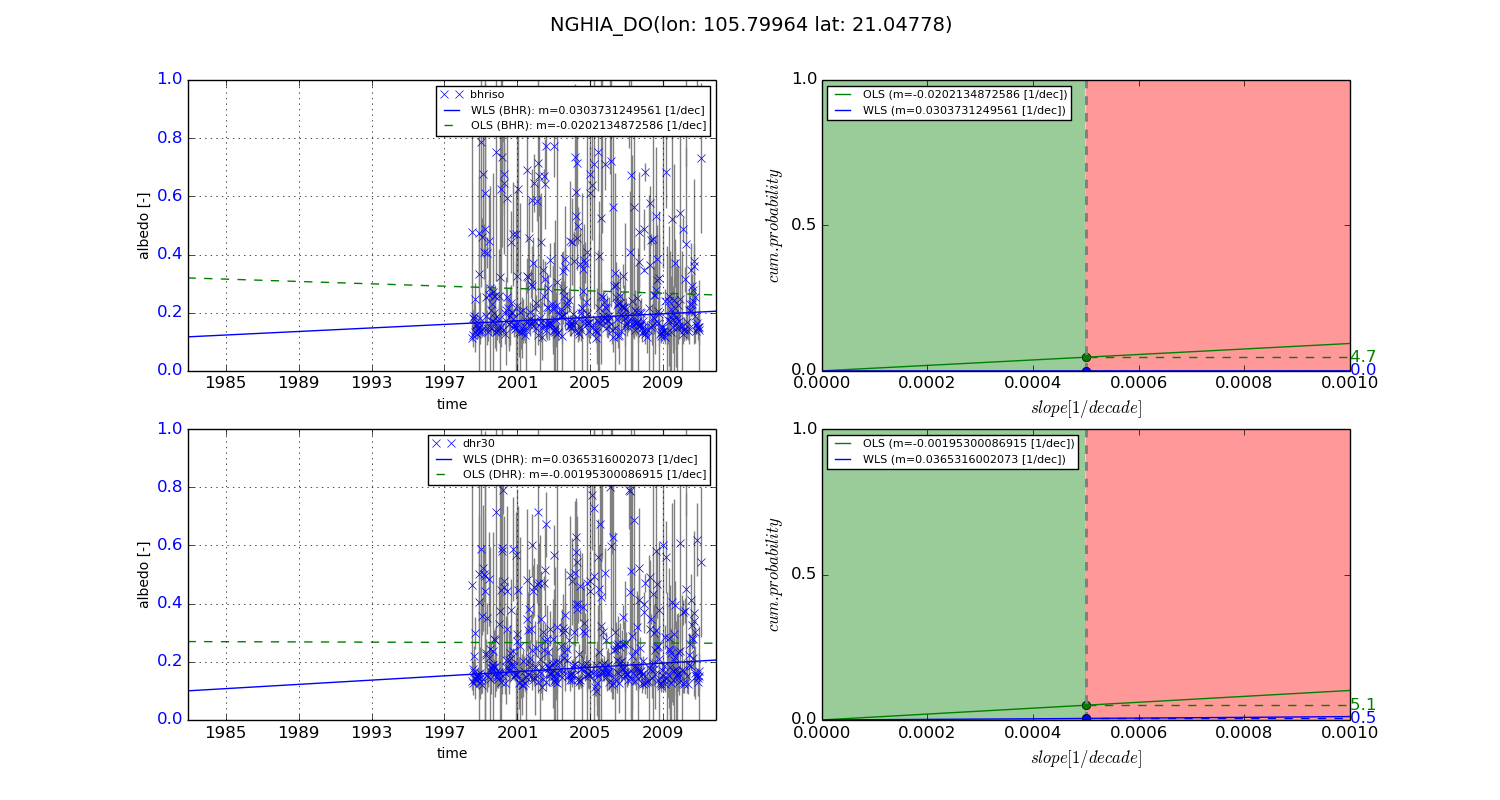
Temporal stability analysis

+000 deg (BHR)


BHR statistics

Temporal stability [1/decade]:


abs

rel


Weighted least square:

None


Ordinary least square:

None


Probabilities that GCOS criteria is met:

Weighted least square:

None %

Ordinary least square:

None %


DHR statistics

Temporal stability [1/decade]:


abs

rel


Weighted least square:

None


Ordinary least square:

None


Probabilities that GCOS criteria is met:

Weighted least square:

None %

Ordinary least square:

None %


+057/+063 deg (BHR)


BHR statistics

Temporal stability [1/decade]:


abs

rel


Weighted least square:

0.0303731249561


Ordinary least square:

-0.0202134872586


Probabilities that GCOS criteria is met:

Weighted least square:

0.0 %

Ordinary least square:

4.7 %


DHR statistics

Temporal stability [1/decade]:


abs

rel


Weighted least square:

0.0365316002073


Ordinary least square:

-0.00195300086915


Probabilities that GCOS criteria is met:

Weighted least square:

0.5 %

Ordinary least square:

5.1 %


Temporal anomaly analyis

The variance of the temporal anomalies provides an additional measure about the stability of the signal AFTER removal of the mean seasonal cylce.

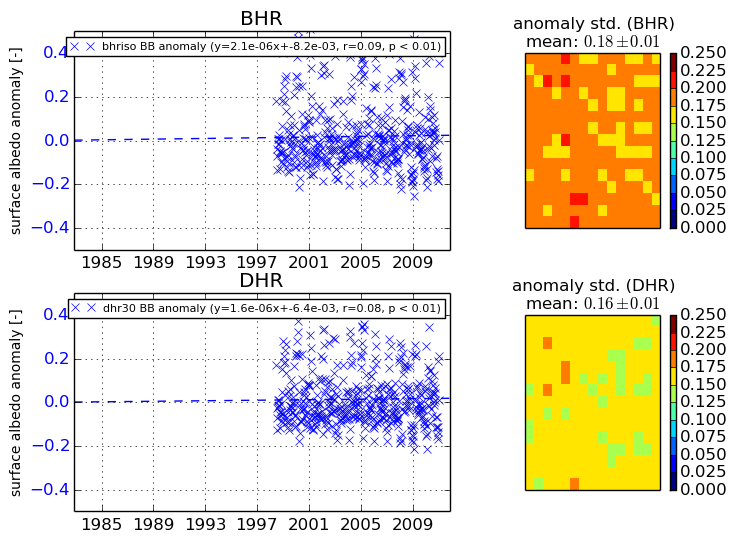
+000 deg


+057/+063 deg