NL-HOR


Location

lon / lat [deg]: 5.0675 / 52.0289

Source network: FLUXNET


Geostationary surface albedo (GSA) data


“+000”


“+057/+063”


Landcover information (based on ESA CCI landcover data)


Landcover fractions @ 2km distance


Landcover fractions @ 20 km distance


Legend


Distance to open water bodies [km]:

0.53

Distance to urban areas [km]:

0.05


Radius: 1 km

Number of landcover classes:

2

Dominant landcover type:

190: urban areas

Fraction of dominant landcover type [%]:

91.0


Radius: 2 km

Number of landcover classes:

3

Dominant landcover type:

190: urban areas

Fraction of dominant landcover type [%]:

88.0


Radius: 5 km

Number of landcover classes:

3

Dominant landcover type:

190: urban areas

Fraction of dominant landcover type [%]:

55.0


Radius: 10 km

Number of landcover classes:

5

Dominant landcover type:

130: grassland

Fraction of dominant landcover type [%]:

50.0


Radius: 20 km

Number of landcover classes:

8

Dominant landcover type:

130: grassland

Fraction of dominant landcover type [%]:

60.0


Disturbances


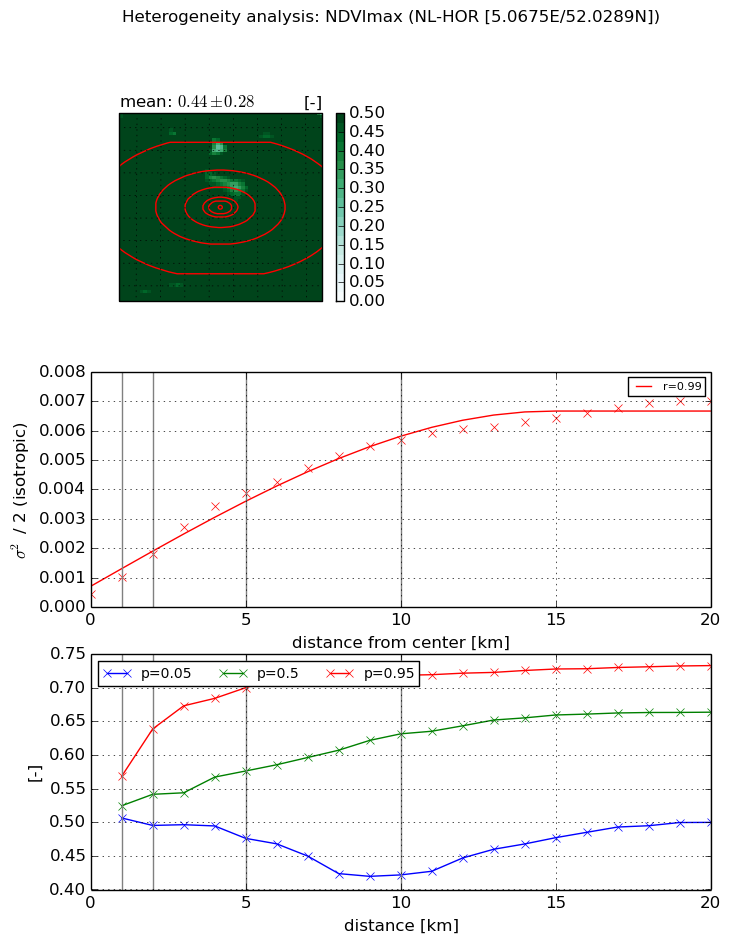
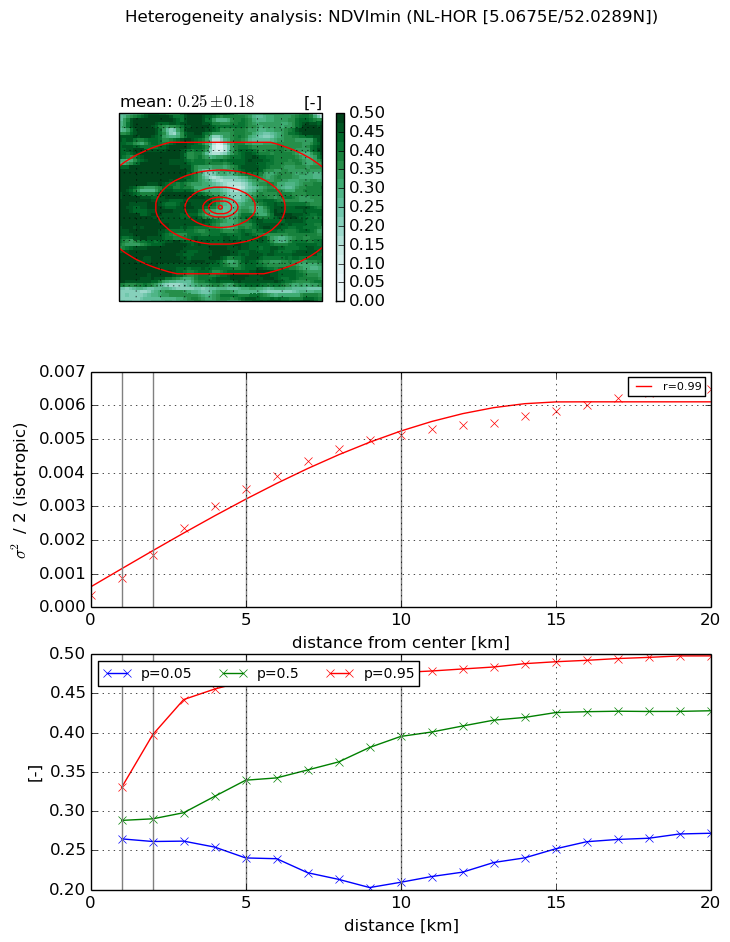
Heterogeneity analysis

The heterogeneity analysis provides information about the spatial and temporal heterogeneity of the site.

Topography


Roman et al. (2009) index


St

9.76520935967

Rcv

0.161680552313

Rse

0.0

Rst

-0.134263653858

Rsv

-0.011268869299


Height range @ 1km [m]

5

Height range @ 2km [m]

4

Height range @ 5km [m]

5

Height range @ 10km [m]

-999

Height range @ 20km [m]

-999


Variance slope @ 1 km

1

Variance slope @ 2 km

0

Variance slope @ 5 km

0

Variance slope @ 10 km

-999

Variance slope @ 20 km

-999


NDVI (max. NDVI composite)


Roman et al. (2009) index


St

2.31234687166

Rcv

0.216259483427

Rse

0.0

Rst

-0.0811264824414

Rsv

-0.999997241111


NDVI range @ 1km [-]

0.06

NDVI range @ 2km [-]

0.14

NDVI range @ 5km [-]

0.22

NDVI range @ 10km [-]

0.3

NDVI range @ 20km [-]

0.23


Variance slope @ 1 km

0.000570983715359

Variance slope @ 2 km

0.000687264206688

Variance slope @ 5 km

0.000724756536891

Variance slope @ 10 km

0.000534664679486

Variance slope @ 20 km

0.000305693869352


NDVI (min. NDVI composite)I


Roman et al. (2009) index


St

3.34409623087e-07

Rcv

0.167197289859

Rse

0.0

Rst

0.0165675340927

Rsv

8971033.52126


NDVI range @ 1km [-]

0.07

NDVI range @ 2km [-]

0.14

NDVI range @ 5km [-]

0.23

NDVI range @ 10km [-]

0.27

NDVI range @ 20km [-]

0.23


NDVI slope @ 1 km

0.000479132047758

NDVI slope @ 2 km

0.000583861182679

NDVI slope @ 5 km

0.000655911778303

NDVI slope @ 10 km

0.000496528764619

NDVI slope @ 20 km

0.000284798391685


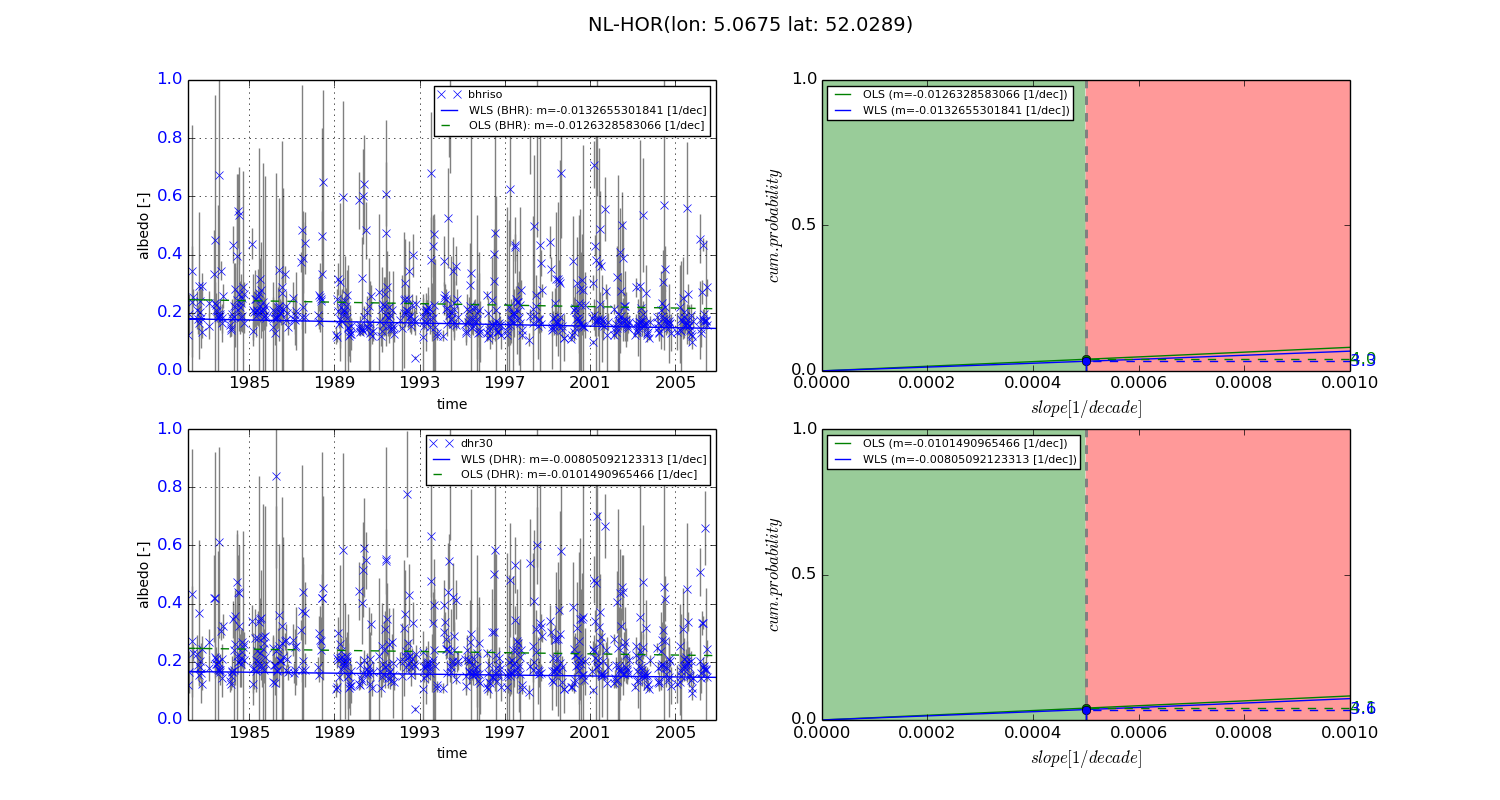
Temporal stability analysis

+000 deg (BHR)


BHR statistics

Temporal stability [1/decade]:


abs

rel


Weighted least square:

-0.0132655301841


Ordinary least square:

-0.0126328583066


Probabilities that GCOS criteria is met:

Weighted least square:

3.3 %

Ordinary least square:

4.0 %


DHR statistics

Temporal stability [1/decade]:


abs

rel


Weighted least square:

-0.00805092123313


Ordinary least square:

-0.0101490965466


Probabilities that GCOS criteria is met:

Weighted least square:

3.6 %

Ordinary least square:

4.1 %


+057/+063 deg (BHR)


BHR statistics

Temporal stability [1/decade]:


abs

rel


Weighted least square:

-99999.0


Ordinary least square:

-99999.0


Probabilities that GCOS criteria is met:

Weighted least square:

-99999.0 %

Ordinary least square:

-99999.0 %


DHR statistics

Temporal stability [1/decade]:


abs

rel


Weighted least square:

-99999.0


Ordinary least square:

-99999.0


Probabilities that GCOS criteria is met:

Weighted least square:

-99999.0 %

Ordinary least square:

-99999.0 %


Temporal anomaly analyis

The variance of the temporal anomalies provides an additional measure about the stability of the signal AFTER removal of the mean seasonal cylce.
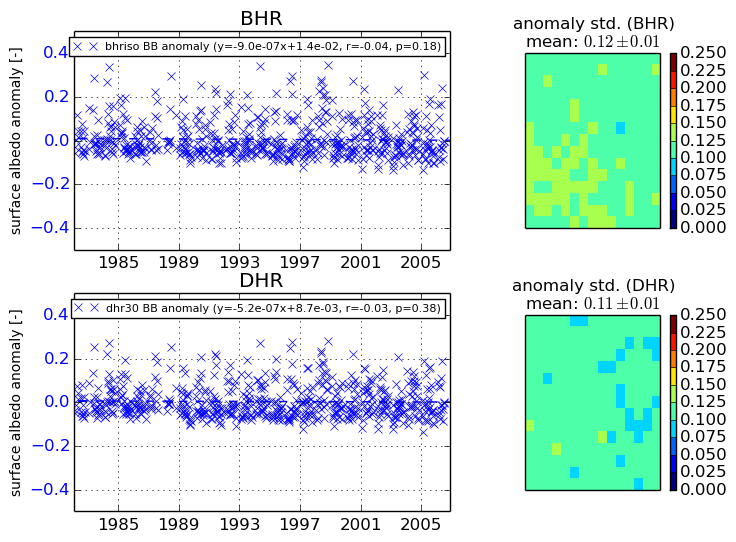
+000 deg


+057/+063 deg