NL-LOO


Location

lon / lat [deg]: 5.744 / 52.1679

Source network: FLUXNET


Geostationary surface albedo (GSA) data


“+000”


“+057/+063”


Landcover information (based on ESA CCI landcover data)


Landcover fractions @ 2km distance


Landcover fractions @ 20 km distance


Legend


Distance to open water bodies [km]:

7.69

Distance to urban areas [km]:

2.69


Radius: 1 km

Number of landcover classes:

3

Dominant landcover type:

70: Tree cover, needleleaved, evergreen, closed to open (>15%)

Fraction of dominant landcover type [%]:

93.0


Radius: 2 km

Number of landcover classes:

5

Dominant landcover type:

70: Tree cover, needleleaved, evergreen, closed to open (>15%)

Fraction of dominant landcover type [%]:

70.0


Radius: 5 km

Number of landcover classes:

9

Dominant landcover type:

70: Tree cover, needleleaved, evergreen, closed to open (>15%)

Fraction of dominant landcover type [%]:

39.0


Radius: 10 km

Number of landcover classes:

11

Dominant landcover type:

70: Tree cover, needleleaved, evergreen, closed to open (>15%)

Fraction of dominant landcover type [%]:

32.0


Radius: 20 km

Number of landcover classes:

10

Dominant landcover type:

70: Tree cover, needleleaved, evergreen, closed to open (>15%)

Fraction of dominant landcover type [%]:

28.0


Disturbances


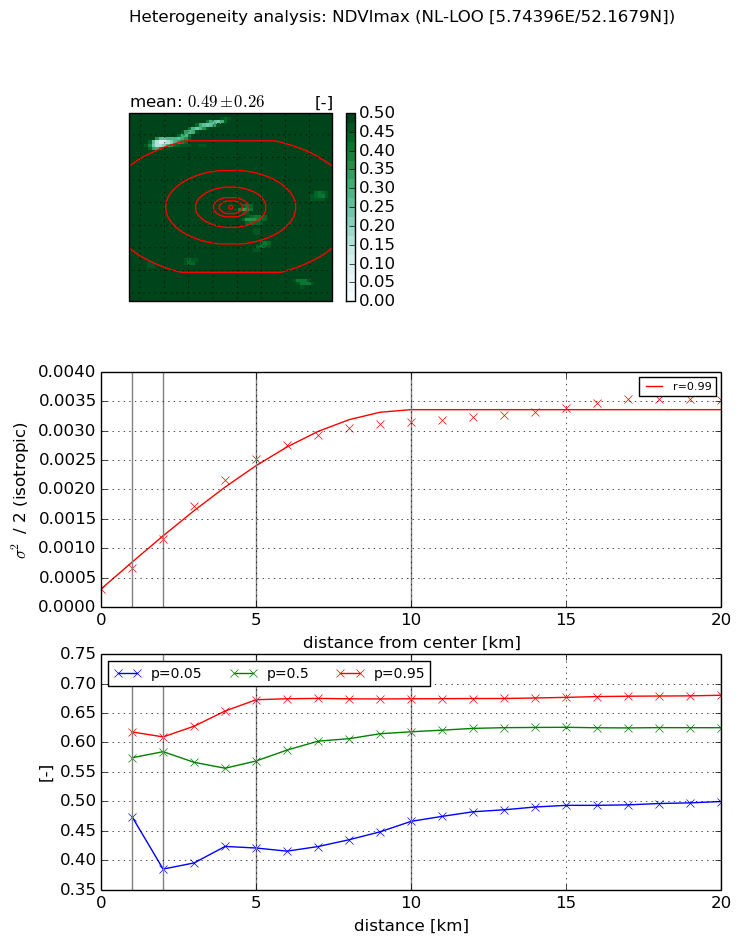
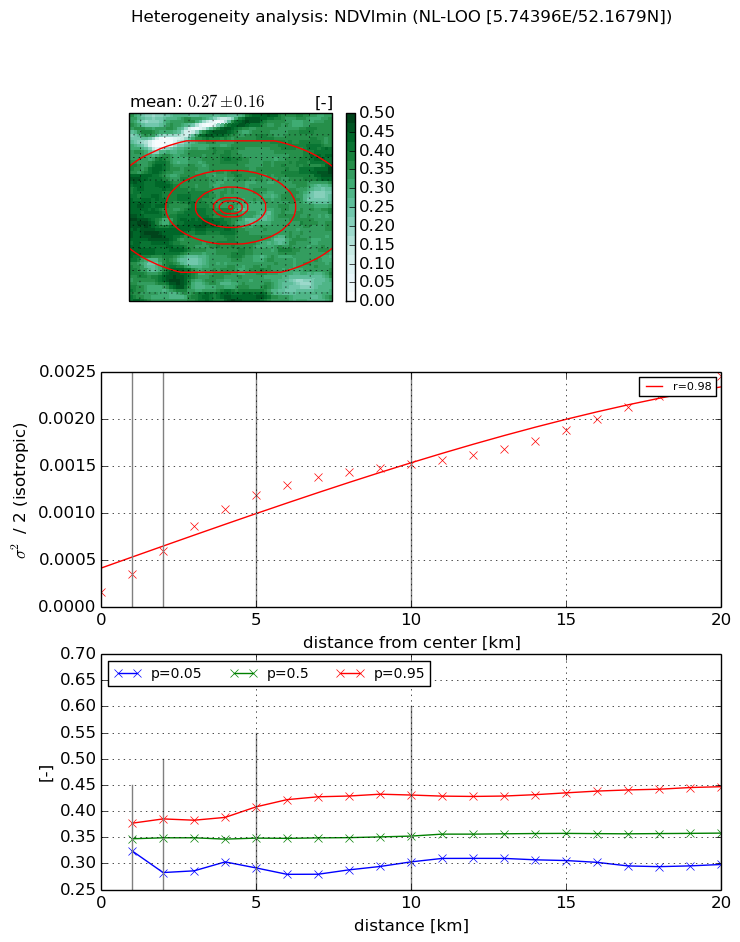
Heterogeneity analysis

The heterogeneity analysis provides information about the spatial and temporal heterogeneity of the site.

Topography


Roman et al. (2009) index


St

4.63385423509

Rcv

0.392429316085

Rse

0.0

Rst

6.09761351098e-10

Rsv

-0.254979912816


Height range @ 1km [m]

9

Height range @ 2km [m]

13

Height range @ 5km [m]

25

Height range @ 10km [m]

-999

Height range @ 20km [m]

-999


Variance slope @ 1 km

11

Variance slope @ 2 km

9

Variance slope @ 5 km

11

Variance slope @ 10 km

-999

Variance slope @ 20 km

-999


NDVI (max. NDVI composite)


Roman et al. (2009) index


St

2.36723215979

Rcv

0.0703416711988

Rse

0.0

Rst

-0.171173216336

Rsv

1.02578793597


NDVI range @ 1km [-]

0.14

NDVI range @ 2km [-]

0.22

NDVI range @ 5km [-]

0.25

NDVI range @ 10km [-]

0.21

NDVI range @ 20km [-]

0.18


Variance slope @ 1 km

0.000365011519961

Variance slope @ 2 km

0.000430267951464

Variance slope @ 5 km

0.000459415699365

Variance slope @ 10 km

0.000296368901488

Variance slope @ 20 km

0.000137333982609


NDVI (min. NDVI composite)I


Roman et al. (2009) index


St

2.15793296111

Rcv

0.156193712388

Rse

0.0

Rst

-0.234026494761

Rsv

-0.999999069385


NDVI range @ 1km [-]

0.05

NDVI range @ 2km [-]

0.1

NDVI range @ 5km [-]

0.12

NDVI range @ 10km [-]

0.13

NDVI range @ 20km [-]

0.15


NDVI slope @ 1 km

0.000185536657185

NDVI slope @ 2 km

0.000215704543195

NDVI slope @ 5 km

0.000213103731445

NDVI slope @ 10 km

0.00013748521436

NDVI slope @ 20 km

9.8046599083e-05


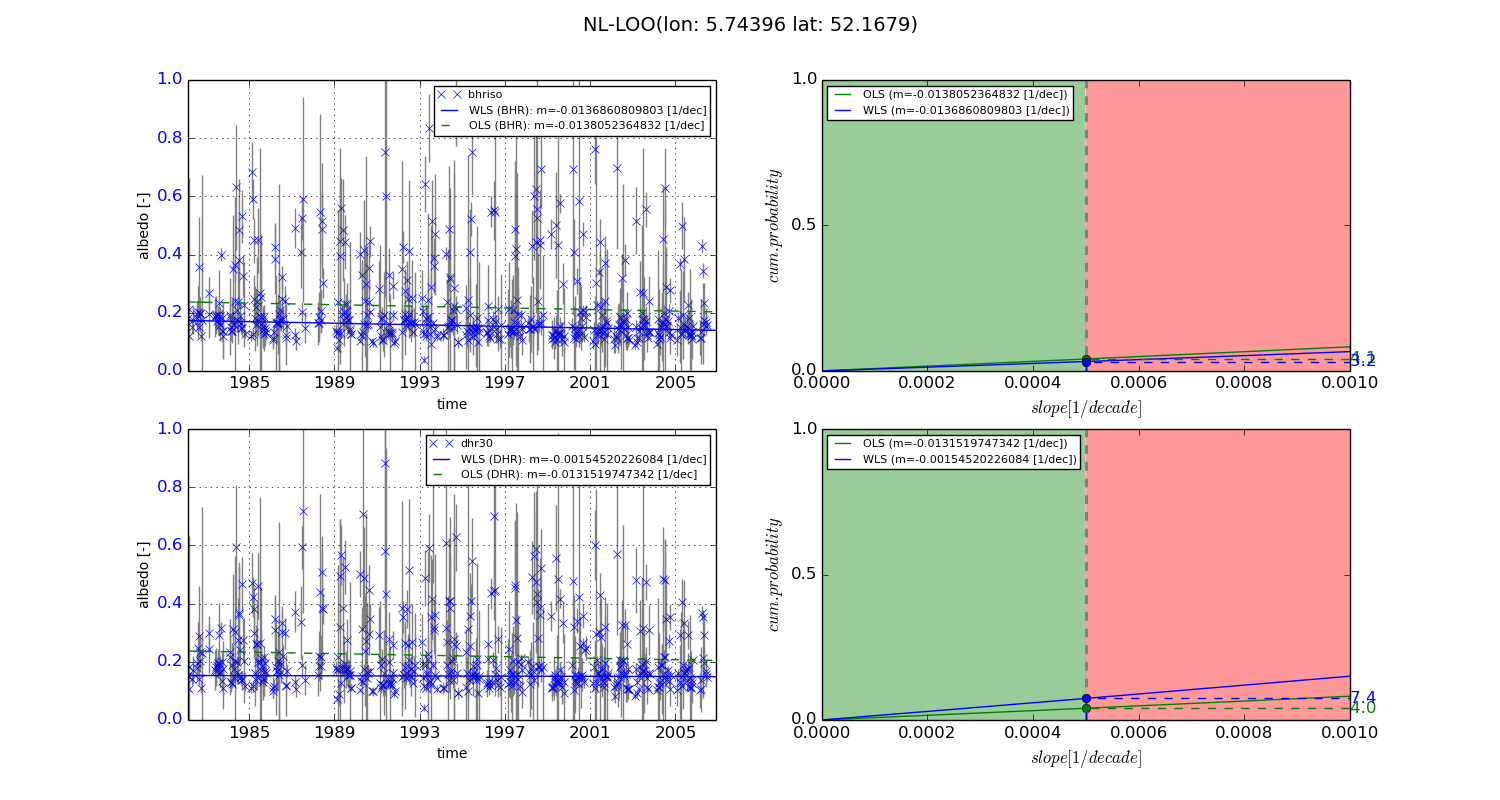
Temporal stability analysis

+000 deg (BHR)


BHR statistics

Temporal stability [1/decade]:


abs

rel


Weighted least square:

-0.0136860809803


Ordinary least square:

-0.0138052364832


Probabilities that GCOS criteria is met:

Weighted least square:

3.2 %

Ordinary least square:

4.1 %


DHR statistics

Temporal stability [1/decade]:


abs

rel


Weighted least square:

-0.00154520226084


Ordinary least square:

-0.0131519747342


Probabilities that GCOS criteria is met:

Weighted least square:

7.4 %

Ordinary least square:

4.0 %


+057/+063 deg (BHR)


BHR statistics

Temporal stability [1/decade]:


abs

rel


Weighted least square:

-99999.0


Ordinary least square:

-99999.0


Probabilities that GCOS criteria is met:

Weighted least square:

-99999.0 %

Ordinary least square:

-99999.0 %


DHR statistics

Temporal stability [1/decade]:


abs

rel


Weighted least square:

-99999.0


Ordinary least square:

-99999.0


Probabilities that GCOS criteria is met:

Weighted least square:

-99999.0 %

Ordinary least square:

-99999.0 %


Temporal anomaly analyis

The variance of the temporal anomalies provides an additional measure about the stability of the signal AFTER removal of the mean seasonal cylce.
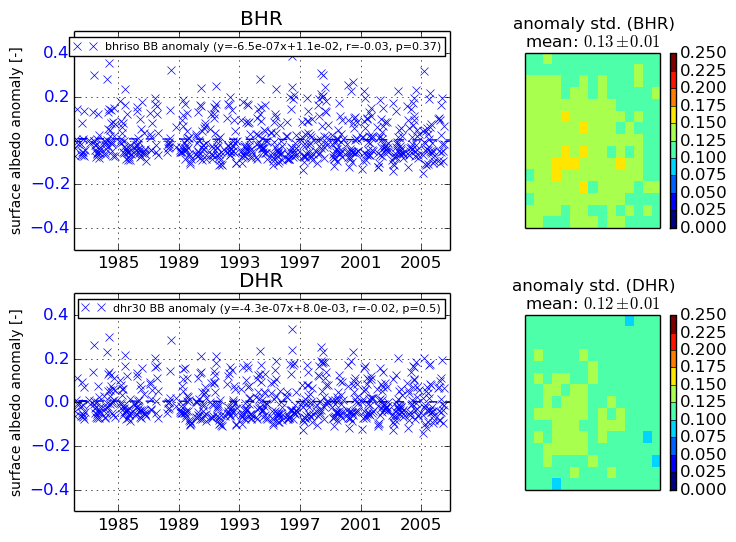
+000 deg


+057/+063 deg