NORTH_TEMPERATE_LAKES_LTER_NTL


Location

lon / lat [deg]: -89.67 / 46.01

Source network: LTER


Geostationary surface albedo (GSA) data


“+000”


“+057/+063”


Landcover information (based on ESA CCI landcover data)


Landcover fractions @ 2km distance


Landcover fractions @ 20 km distance


Legend


Distance to open water bodies [km]:

0.59

Distance to urban areas [km]:

5.79


Radius: 1 km

Number of landcover classes:

6

Dominant landcover type:

160: Tree cover, flooded, fresh or brakish water

Fraction of dominant landcover type [%]:

40.0


Radius: 2 km

Number of landcover classes:

6

Dominant landcover type:

210: water bodies

Fraction of dominant landcover type [%]:

35.0


Radius: 5 km

Number of landcover classes:

7

Dominant landcover type:

210: water bodies

Fraction of dominant landcover type [%]:

35.0


Radius: 10 km

Number of landcover classes:

7

Dominant landcover type:

90: Tree cover, mixed leaf type

Fraction of dominant landcover type [%]:

25.0


Radius: 20 km

Number of landcover classes:

7

Dominant landcover type:

90: Tree cover, mixed leaf type

Fraction of dominant landcover type [%]:

26.0


Disturbances


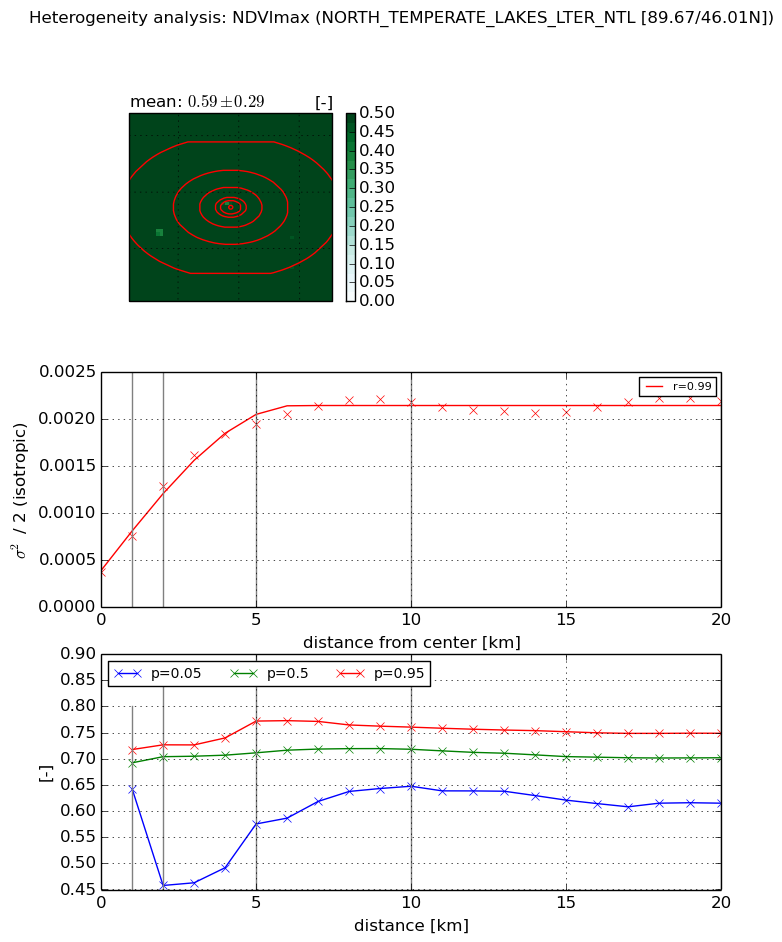
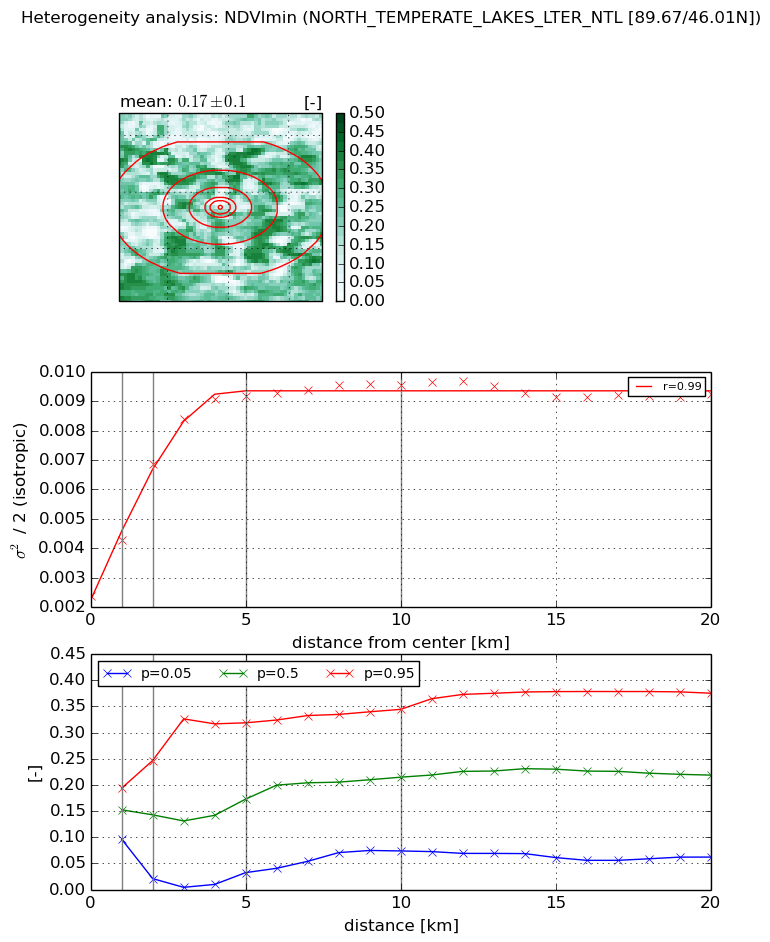
Heterogeneity analysis

The heterogeneity analysis provides information about the spatial and temporal heterogeneity of the site.

Topography


Roman et al. (2009) index


St

7.10951137382e-06

Rcv

0.306231619068

Rse

0.0

Rst

-0.125303600841

Rsv

421969.49611


Height range @ 1km [m]

18

Height range @ 2km [m]

19

Height range @ 5km [m]

36

Height range @ 10km [m]

-999

Height range @ 20km [m]

-999


Variance slope @ 1 km

60

Variance slope @ 2 km

37

Variance slope @ 5 km

18

Variance slope @ 10 km

-999

Variance slope @ 20 km

-999


NDVI (max. NDVI composite)


Roman et al. (2009) index


St

4.34417882571

Rcv

-0.278244416441

Rse

0.0

Rst

0.0720248667967

Rsv

-0.340310023084


NDVI range @ 1km [-]

0.07

NDVI range @ 2km [-]

0.27

NDVI range @ 5km [-]

0.2

NDVI range @ 10km [-]

0.11

NDVI range @ 20km [-]

0.13


Variance slope @ 1 km

0.00038025624542

Variance slope @ 2 km

0.000453204302698

Variance slope @ 5 km

0.000327551938386

Variance slope @ 10 km

0.000170990727494

Variance slope @ 20 km

5.81375055193e-05


NDVI (min. NDVI composite)I


Roman et al. (2009) index


St

4.35814710404

Rcv

-0.195534567232

Rse

0.0

Rst

0.194721071266

Rsv

-0.298110295092


NDVI range @ 1km [-]

0.1

NDVI range @ 2km [-]

0.23

NDVI range @ 5km [-]

0.29

NDVI range @ 10km [-]

0.27

NDVI range @ 20km [-]

0.31


NDVI slope @ 1 km

0.00191916033791

NDVI slope @ 2 km

0.00225234464131

NDVI slope @ 5 km

0.00142860194373

NDVI slope @ 10 km

0.000612528521211

NDVI slope @ 20 km

0.000178879692941


Temporal stability analysis

+000 deg (BHR)


BHR statistics

Temporal stability [1/decade]:


abs

rel


Weighted least square:

None


Ordinary least square:

None


Probabilities that GCOS criteria is met:

Weighted least square:

None %

Ordinary least square:

None %


DHR statistics

Temporal stability [1/decade]:


abs

rel


Weighted least square:

None


Ordinary least square:

None


Probabilities that GCOS criteria is met:

Weighted least square:

None %

Ordinary least square:

None %


+057/+063 deg (BHR)


BHR statistics

Temporal stability [1/decade]:


abs

rel


Weighted least square:

None


Ordinary least square:

None


Probabilities that GCOS criteria is met:

Weighted least square:

None %

Ordinary least square:

None %


DHR statistics

Temporal stability [1/decade]:


abs

rel


Weighted least square:

None


Ordinary least square:

None


Probabilities that GCOS criteria is met:

Weighted least square:

None %

Ordinary least square:

None %


Temporal anomaly analyis

The variance of the temporal anomalies provides an additional measure about the stability of the signal AFTER removal of the mean seasonal cylce.

+000 deg


+057/+063 deg