OHP_OBSERVATOIRE


Location

lon / lat [deg]: 5.71 / 43.935

Source network: AERONET


Geostationary surface albedo (GSA) data


“+000”


“+057/+063”


Landcover information (based on ESA CCI landcover data)


Landcover fractions @ 2km distance


Landcover fractions @ 20 km distance


Legend


Distance to open water bodies [km]:

3.25

Distance to urban areas [km]:

4.26


Radius: 1 km

Number of landcover classes:

5

Dominant landcover type:

10: cropland, rainfed

Fraction of dominant landcover type [%]:

44.0


Radius: 2 km

Number of landcover classes:

7

Dominant landcover type:

10: cropland, rainfed

Fraction of dominant landcover type [%]:

59.0


Radius: 5 km

Number of landcover classes:

6

Dominant landcover type:

10: cropland, rainfed

Fraction of dominant landcover type [%]:

84.0


Radius: 10 km

Number of landcover classes:

8

Dominant landcover type:

10: cropland, rainfed

Fraction of dominant landcover type [%]:

71.0


Radius: 20 km

Number of landcover classes:

8

Dominant landcover type:

10: cropland, rainfed

Fraction of dominant landcover type [%]:

62.0


Disturbances


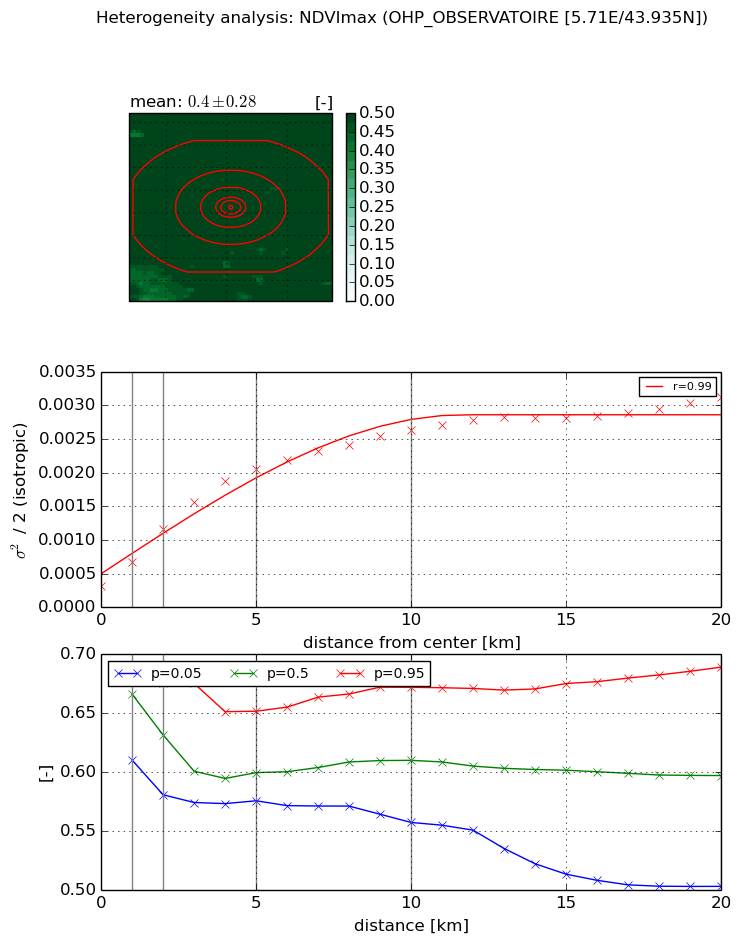
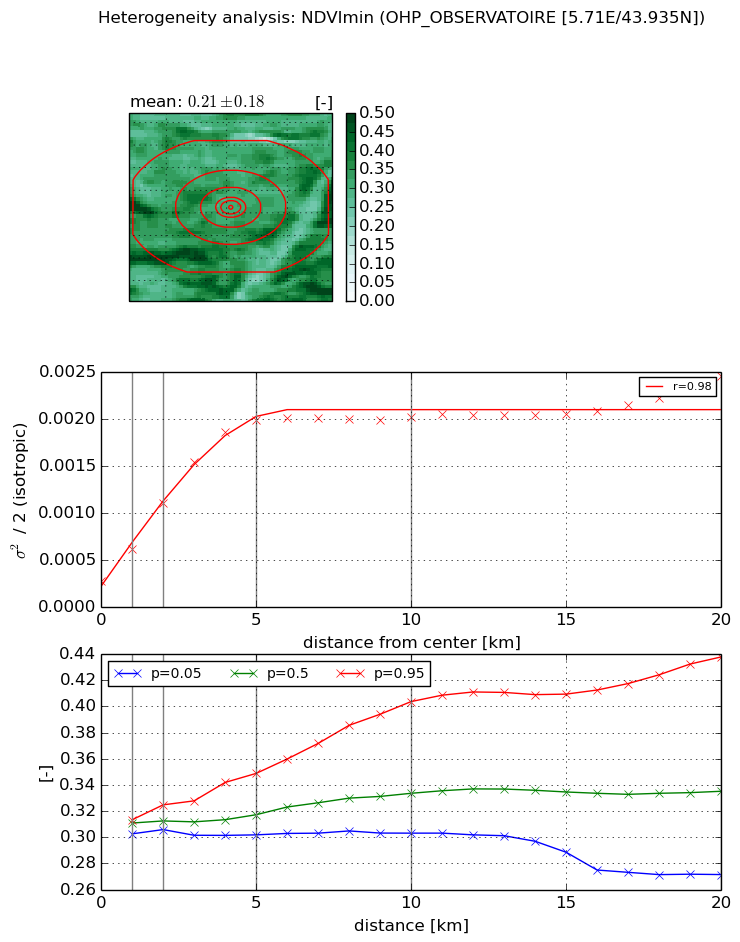
Heterogeneity analysis

The heterogeneity analysis provides information about the spatial and temporal heterogeneity of the site.

Topography


Roman et al. (2009) index


St

3.26102410182

Rcv

0.29450460392

Rse

0.0

Rst

-0.115386319641

Rsv

0.510065478577


Height range @ 1km [m]

108

Height range @ 2km [m]

226

Height range @ 5km [m]

336

Height range @ 10km [m]

-999

Height range @ 20km [m]

-999


Variance slope @ 1 km

3149

Variance slope @ 2 km

3343

Variance slope @ 5 km

2006

Variance slope @ 10 km

-999

Variance slope @ 20 km

-999


NDVI (max. NDVI composite)


Roman et al. (2009) index


St

nan

Rcv

nan

Rse

nan

Rst

nan

Rsv

nan


NDVI range @ 1km [-]

0.07

NDVI range @ 2km [-]

0.09

NDVI range @ 5km [-]

0.08

NDVI range @ 10km [-]

0.11

NDVI range @ 20km [-]

0.19


Variance slope @ 1 km

0.000360092717015

Variance slope @ 2 km

0.000424369343304

Variance slope @ 5 km

0.000361729965999

Variance slope @ 10 km

0.000223681102728

Variance slope @ 20 km

0.000113265050344


NDVI (min. NDVI composite)I


Roman et al. (2009) index


St

1.0724792544e-07

Rcv

0.51723399523

Rse

0.0

Rst

0.0935953472754

Rsv

27972568.4406


NDVI range @ 1km [-]

0.01

NDVI range @ 2km [-]

0.02

NDVI range @ 5km [-]

0.05

NDVI range @ 10km [-]

0.1

NDVI range @ 20km [-]

0.17


NDVI slope @ 1 km

0.000339071467422

NDVI slope @ 2 km

0.000418796740159

NDVI slope @ 5 km

0.000364820093161

NDVI slope @ 10 km

0.000163350021172

NDVI slope @ 20 km

6.78858223445e-05


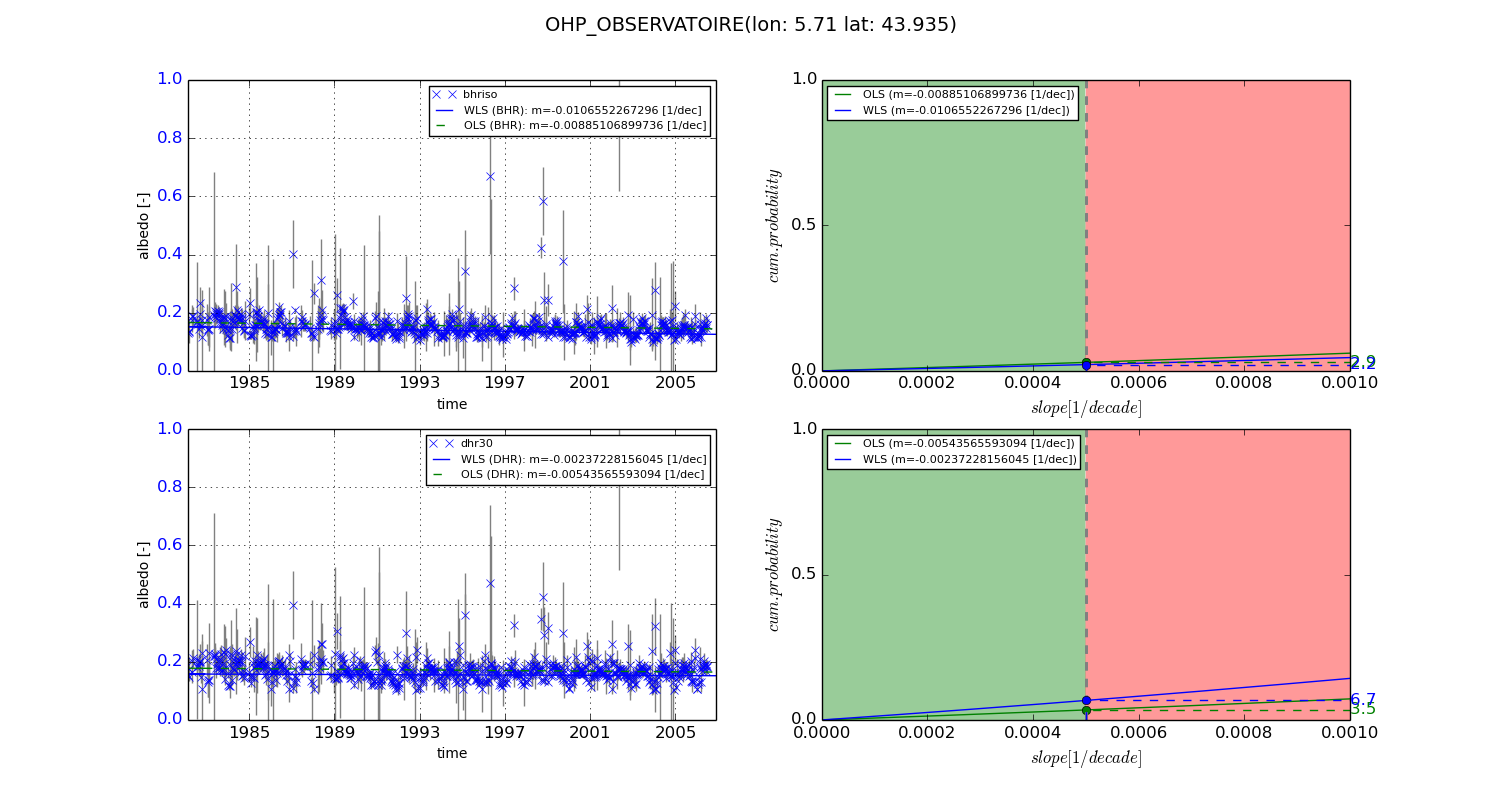
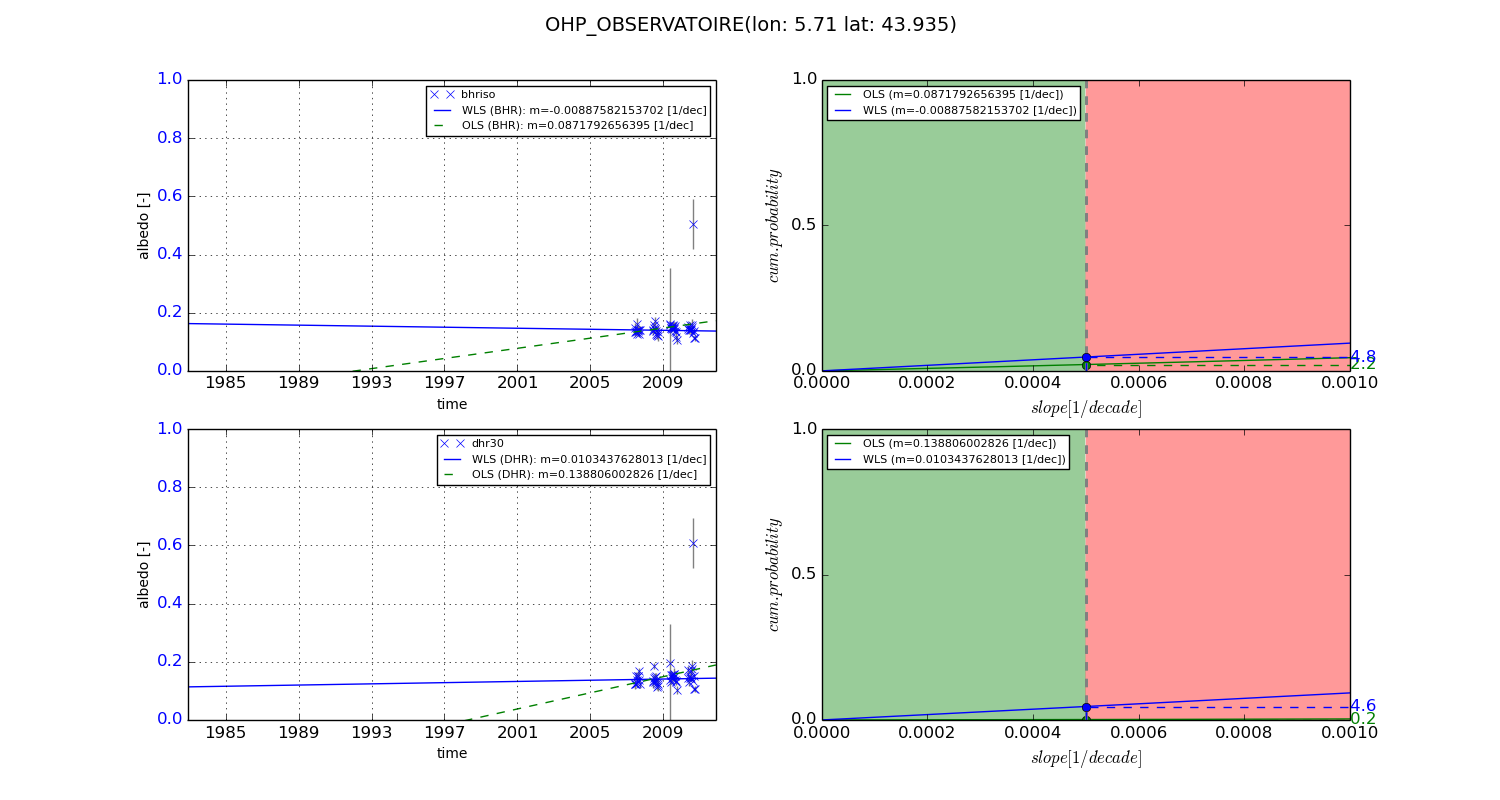
Temporal stability analysis

+000 deg (BHR)


BHR statistics

Temporal stability [1/decade]:


abs

rel


Weighted least square:

-0.0106552267296


Ordinary least square:

-0.00885106899736


Probabilities that GCOS criteria is met:

Weighted least square:

2.2 %

Ordinary least square:

2.9 %


DHR statistics

Temporal stability [1/decade]:


abs

rel


Weighted least square:

-0.00237228156045


Ordinary least square:

-0.00543565593094


Probabilities that GCOS criteria is met:

Weighted least square:

6.7 %

Ordinary least square:

3.5 %


+057/+063 deg (BHR)


BHR statistics

Temporal stability [1/decade]:


abs

rel


Weighted least square:

-0.00887582153702


Ordinary least square:

0.0871792656395


Probabilities that GCOS criteria is met:

Weighted least square:

4.8 %

Ordinary least square:

2.2 %


DHR statistics

Temporal stability [1/decade]:


abs

rel


Weighted least square:

0.0103437628013


Ordinary least square:

0.138806002826


Probabilities that GCOS criteria is met:

Weighted least square:

4.6 %

Ordinary least square:

0.2 %


Temporal anomaly analyis

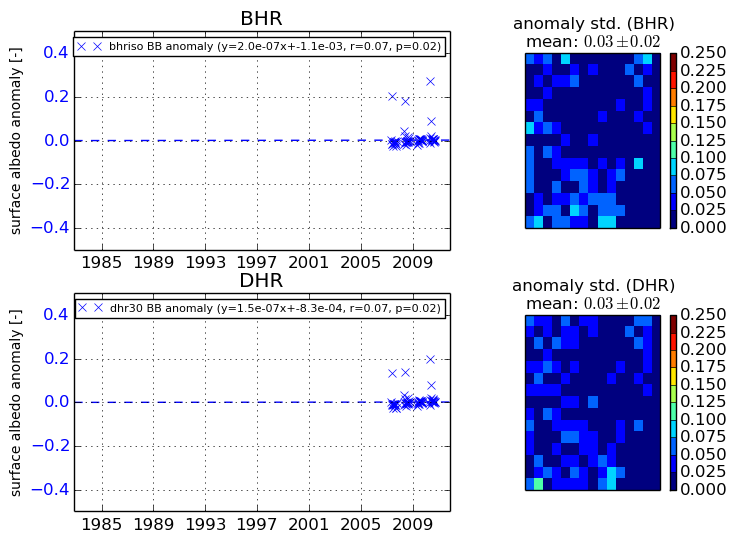
The variance of the temporal anomalies provides an additional measure about the stability of the signal AFTER removal of the mean seasonal cylce.
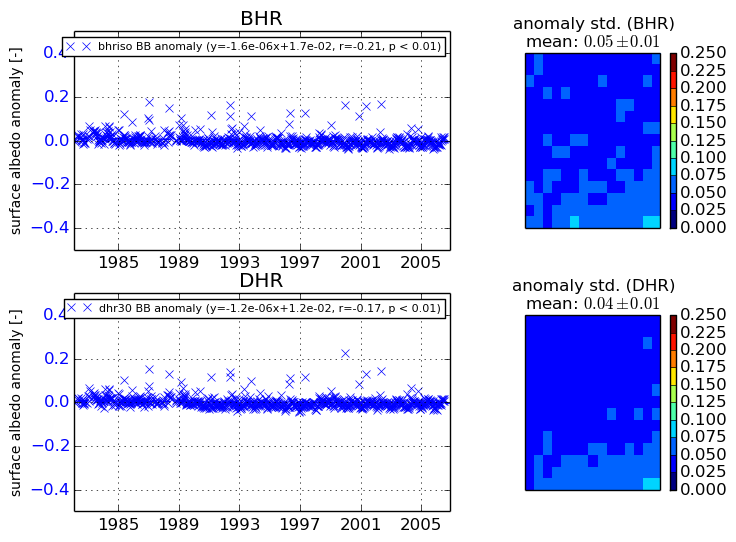
+000 deg


+057/+063 deg