OKEFENOKEENWR


Location

lon / lat [deg]: -82.1286 / 30.7411

Source network: AERONET


Geostationary surface albedo (GSA) data


“+000”


“+057/+063”


Landcover information (based on ESA CCI landcover data)


Landcover fractions @ 2km distance


Landcover fractions @ 20 km distance


Legend


Distance to open water bodies [km]:

3.95

Distance to urban areas [km]:

1.96


Radius: 1 km

Number of landcover classes:

3

Dominant landcover type:

70: Tree cover, needleleaved, evergreen, closed to open (>15%)

Fraction of dominant landcover type [%]:

81.0


Radius: 2 km

Number of landcover classes:

4

Dominant landcover type:

70: Tree cover, needleleaved, evergreen, closed to open (>15%)

Fraction of dominant landcover type [%]:

61.0


Radius: 5 km

Number of landcover classes:

5

Dominant landcover type:

70: Tree cover, needleleaved, evergreen, closed to open (>15%)

Fraction of dominant landcover type [%]:

55.0


Radius: 10 km

Number of landcover classes:

5

Dominant landcover type:

70: Tree cover, needleleaved, evergreen, closed to open (>15%)

Fraction of dominant landcover type [%]:

48.0


Radius: 20 km

Number of landcover classes:

5

Dominant landcover type:

160: Tree cover, flooded, fresh or brakish water

Fraction of dominant landcover type [%]:

44.0


Disturbances


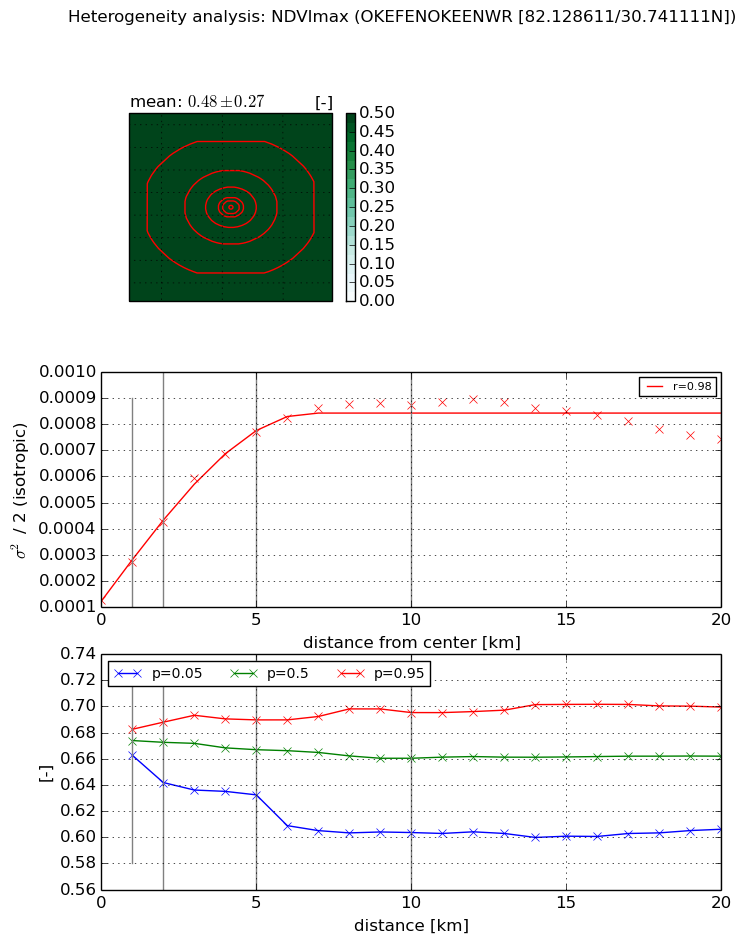
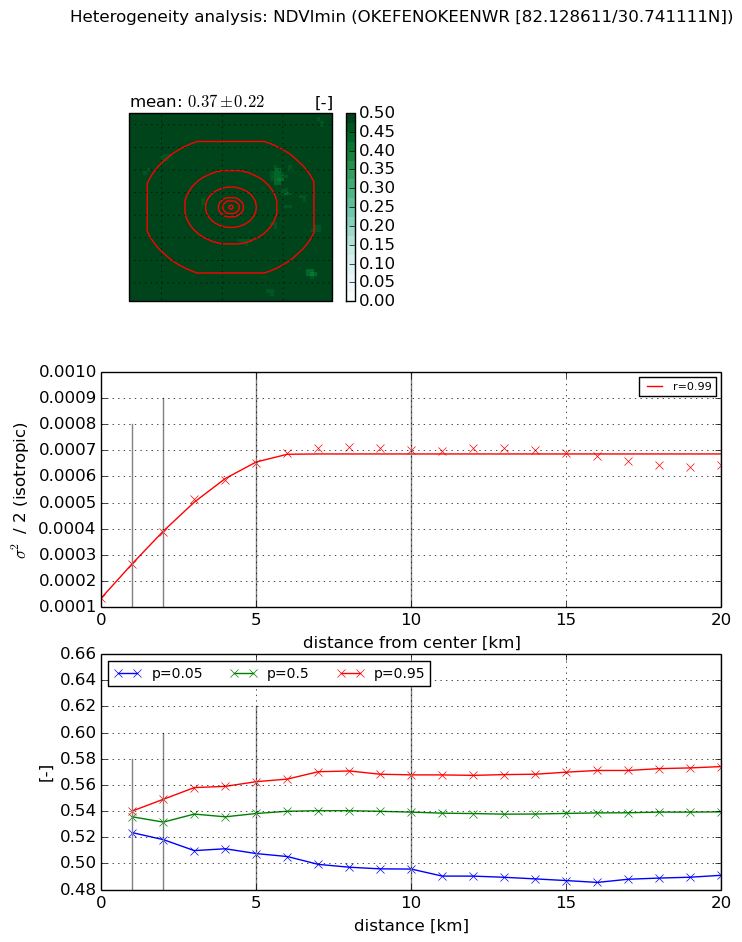
Heterogeneity analysis

The heterogeneity analysis provides information about the spatial and temporal heterogeneity of the site.

Topography


Roman et al. (2009) index


St

1.86474129717

Rcv

0.610860369638

Rse

0.0

Rst

0.00693500040382

Rsv

0.991006882877


Height range @ 1km [m]

9

Height range @ 2km [m]

14

Height range @ 5km [m]

27

Height range @ 10km [m]

-999

Height range @ 20km [m]

-999


Variance slope @ 1 km

12

Variance slope @ 2 km

14

Variance slope @ 5 km

18

Variance slope @ 10 km

-999

Variance slope @ 20 km

-999


NDVI (max. NDVI composite)


Roman et al. (2009) index


St

7.75694924819e-07

Rcv

0.0422256056701

Rse

0.0

Rst

0.193682242426

Rsv

3867499.60715


NDVI range @ 1km [-]

0.02

NDVI range @ 2km [-]

0.05

NDVI range @ 5km [-]

0.06

NDVI range @ 10km [-]

0.09

NDVI range @ 20km [-]

0.09


Variance slope @ 1 km

0.000144565119707

Variance slope @ 2 km

0.000148614726329

Variance slope @ 5 km

0.000131689320886

Variance slope @ 10 km

7.45653533068e-05

Variance slope @ 20 km

2.1392777053e-05


NDVI (min. NDVI composite)I


Roman et al. (2009) index


St

2.34628047763e-07

Rcv

0.0560392827029

Rse

0.0

Rst

0.210002992199

Rsv

12786194.8569


NDVI range @ 1km [-]

0.02

NDVI range @ 2km [-]

0.03

NDVI range @ 5km [-]

0.06

NDVI range @ 10km [-]

0.07

NDVI range @ 20km [-]

0.08


NDVI slope @ 1 km

0.000129771939796

NDVI slope @ 2 km

0.000126323300755

NDVI slope @ 5 km

0.000104651646048

NDVI slope @ 10 km

5.52568674607e-05

NDVI slope @ 20 km

1.59478845971e-05


Temporal stability analysis

+000 deg (BHR)


BHR statistics

Temporal stability [1/decade]:


abs

rel


Weighted least square:

None


Ordinary least square:

None


Probabilities that GCOS criteria is met:

Weighted least square:

None %

Ordinary least square:

None %


DHR statistics

Temporal stability [1/decade]:


abs

rel


Weighted least square:

None


Ordinary least square:

None


Probabilities that GCOS criteria is met:

Weighted least square:

None %

Ordinary least square:

None %


+057/+063 deg (BHR)


BHR statistics

Temporal stability [1/decade]:


abs

rel


Weighted least square:

None


Ordinary least square:

None


Probabilities that GCOS criteria is met:

Weighted least square:

None %

Ordinary least square:

None %


DHR statistics

Temporal stability [1/decade]:


abs

rel


Weighted least square:

None


Ordinary least square:

None


Probabilities that GCOS criteria is met:

Weighted least square:

None %

Ordinary least square:

None %


Temporal anomaly analyis

The variance of the temporal anomalies provides an additional measure about the stability of the signal AFTER removal of the mean seasonal cylce.

+000 deg


+057/+063 deg