ORLEAN_BRICY


Location

lon / lat [deg]: 1.7611 / 47.9867

Source network: AERONET


Geostationary surface albedo (GSA) data


“+000”


“+057/+063”


Landcover information (based on ESA CCI landcover data)


Landcover fractions @ 2km distance


Landcover fractions @ 20 km distance


Legend


Distance to open water bodies [km]:

12.66

Distance to urban areas [km]:

0.14


Radius: 1 km

Number of landcover classes:

2

Dominant landcover type:

190: urban areas

Fraction of dominant landcover type [%]:

98.0


Radius: 2 km

Number of landcover classes:

2

Dominant landcover type:

190: urban areas

Fraction of dominant landcover type [%]:

60.0


Radius: 5 km

Number of landcover classes:

3

Dominant landcover type:

10: cropland, rainfed

Fraction of dominant landcover type [%]:

87.0


Radius: 10 km

Number of landcover classes:

3

Dominant landcover type:

10: cropland, rainfed

Fraction of dominant landcover type [%]:

82.0


Radius: 20 km

Number of landcover classes:

3

Dominant landcover type:

10: cropland, rainfed

Fraction of dominant landcover type [%]:

76.0


Disturbances


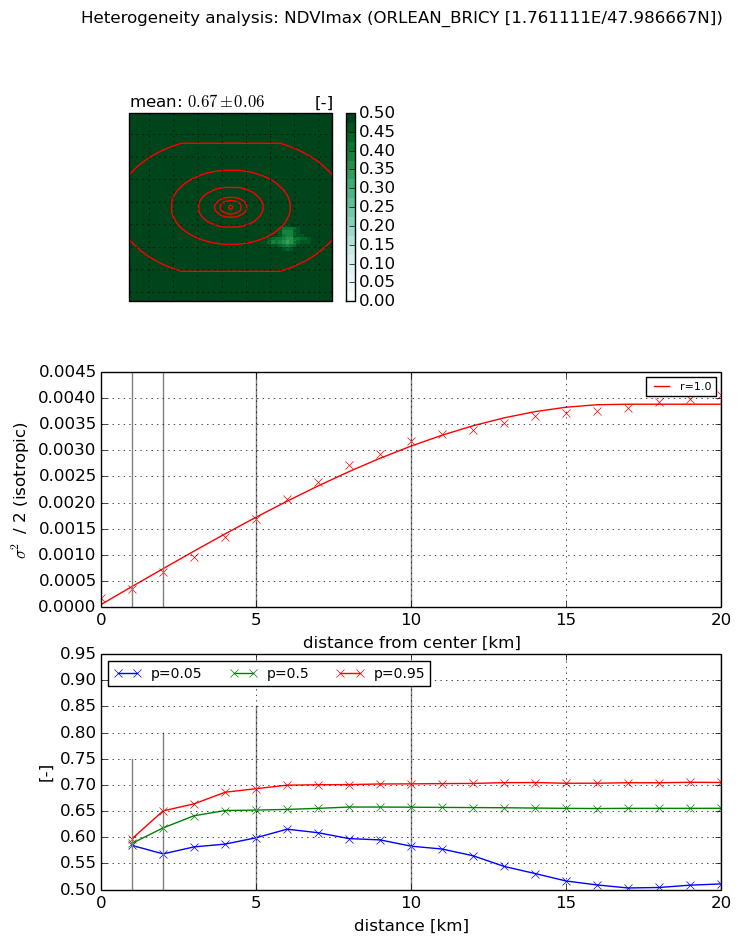
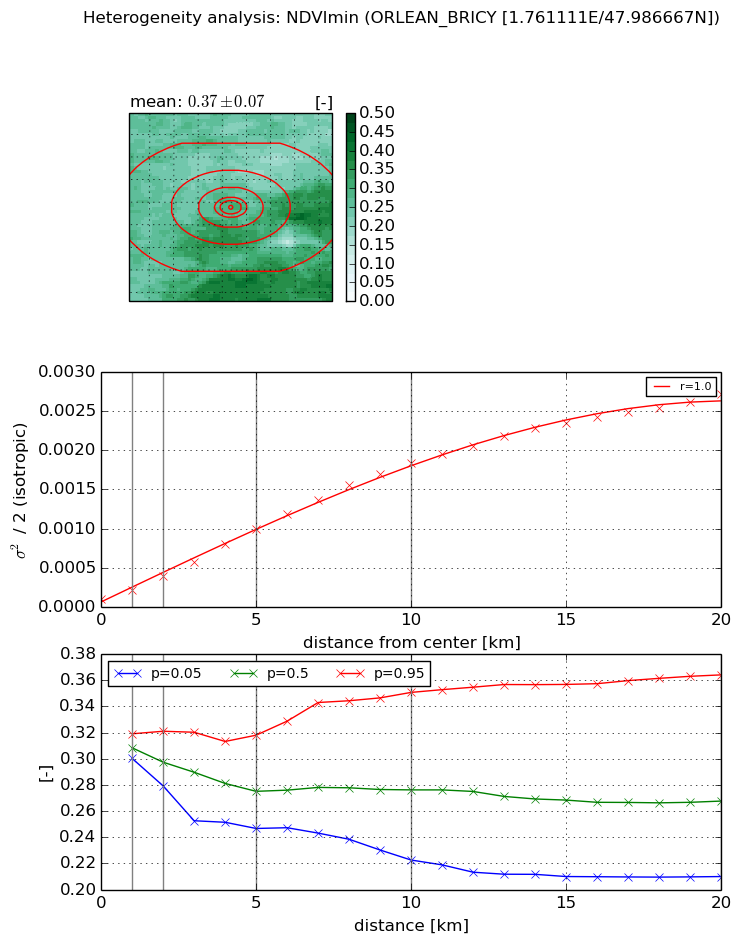
Heterogeneity analysis

The heterogeneity analysis provides information about the spatial and temporal heterogeneity of the site.

Topography


Roman et al. (2009) index


St

9.06715012707

Rcv

0.221104336973

Rse

0.0

Rst

0.0837161750692

Rsv

0.0260441982535


Height range @ 1km [m]

7

Height range @ 2km [m]

8

Height range @ 5km [m]

10

Height range @ 10km [m]

-999

Height range @ 20km [m]

-999


Variance slope @ 1 km

7

Variance slope @ 2 km

4

Variance slope @ 5 km

1

Variance slope @ 10 km

-999

Variance slope @ 20 km

-999


NDVI (max. NDVI composite)


Roman et al. (2009) index


St

2.54526757435

Rcv

-0.0908368180024

Rse

0.0

Rst

-0.23563752934

Rsv

0.852183657117


NDVI range @ 1km [-]

0.01

NDVI range @ 2km [-]

0.08

NDVI range @ 5km [-]

0.09

NDVI range @ 10km [-]

0.12

NDVI range @ 20km [-]

0.19


Variance slope @ 1 km

0.000177497583955

Variance slope @ 2 km

0.000249499811079

Variance slope @ 5 km

0.000309738126175

Variance slope @ 10 km

0.000318161194711

Variance slope @ 20 km

0.00019945997364


NDVI (min. NDVI composite)I


Roman et al. (2009) index


St

nan

Rcv

nan

Rse

nan

Rst

nan

Rsv

nan


NDVI range @ 1km [-]

0.02

NDVI range @ 2km [-]

0.04

NDVI range @ 5km [-]

0.07

NDVI range @ 10km [-]

0.13

NDVI range @ 20km [-]

0.15


NDVI slope @ 1 km

0.00011164114905

NDVI slope @ 2 km

0.000147285473736

NDVI slope @ 5 km

0.000181349200065

NDVI slope @ 10 km

0.000181684903601

NDVI slope @ 20 km

0.000133351966788


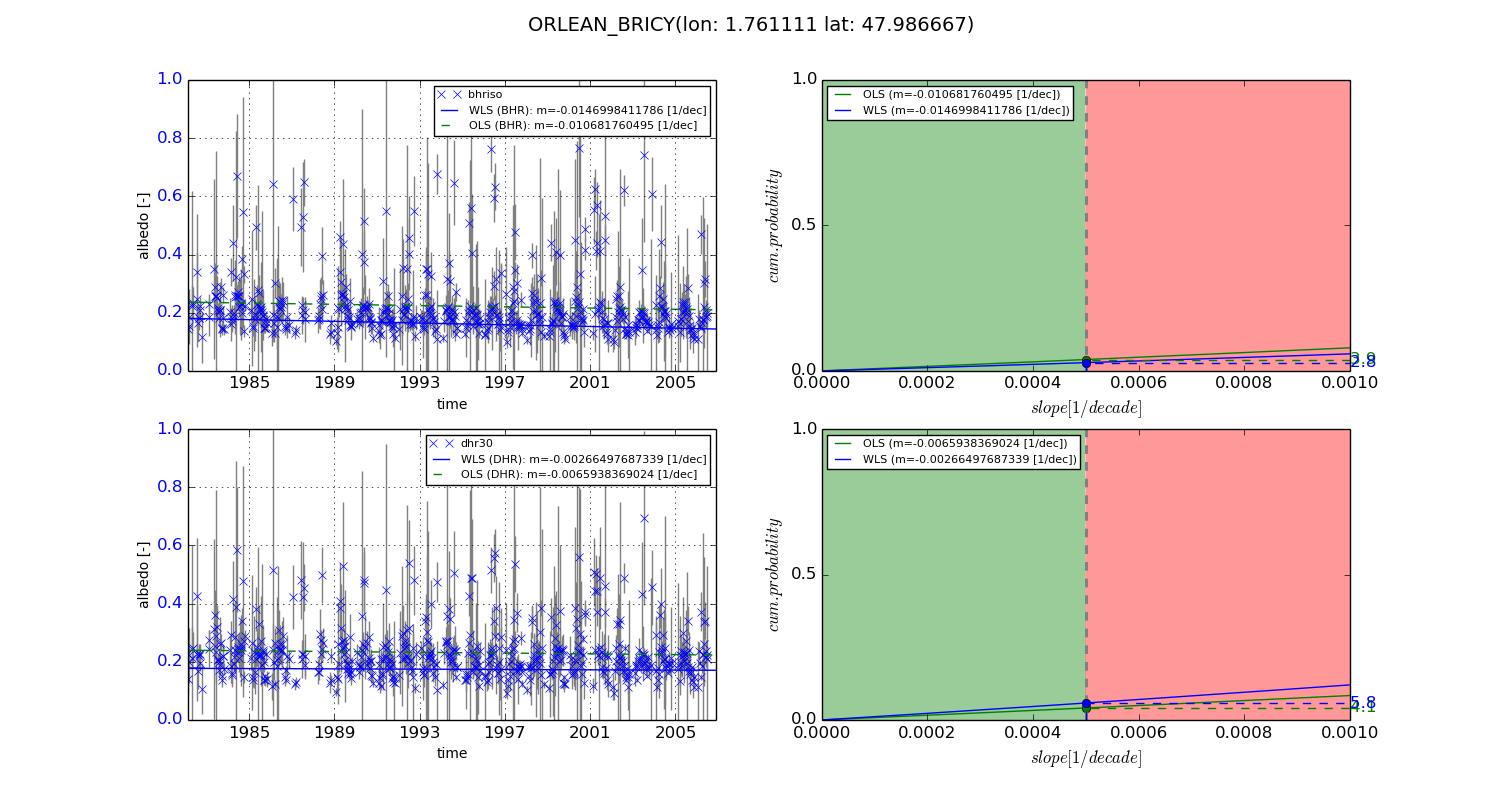
Temporal stability analysis

+000 deg (BHR)


BHR statistics

Temporal stability [1/decade]:


abs

rel


Weighted least square:

-0.0146998411786


Ordinary least square:

-0.010681760495


Probabilities that GCOS criteria is met:

Weighted least square:

2.8 %

Ordinary least square:

3.9 %


DHR statistics

Temporal stability [1/decade]:


abs

rel


Weighted least square:

-0.00266497687339


Ordinary least square:

-0.0065938369024


Probabilities that GCOS criteria is met:

Weighted least square:

5.8 %

Ordinary least square:

4.1 %


+057/+063 deg (BHR)


BHR statistics

Temporal stability [1/decade]:


abs

rel


Weighted least square:

-99999.0


Ordinary least square:

-99999.0


Probabilities that GCOS criteria is met:

Weighted least square:

-99999.0 %

Ordinary least square:

-99999.0 %


DHR statistics

Temporal stability [1/decade]:


abs

rel


Weighted least square:

-99999.0


Ordinary least square:

-99999.0


Probabilities that GCOS criteria is met:

Weighted least square:

-99999.0 %

Ordinary least square:

-99999.0 %


Temporal anomaly analyis

The variance of the temporal anomalies provides an additional measure about the stability of the signal AFTER removal of the mean seasonal cylce.
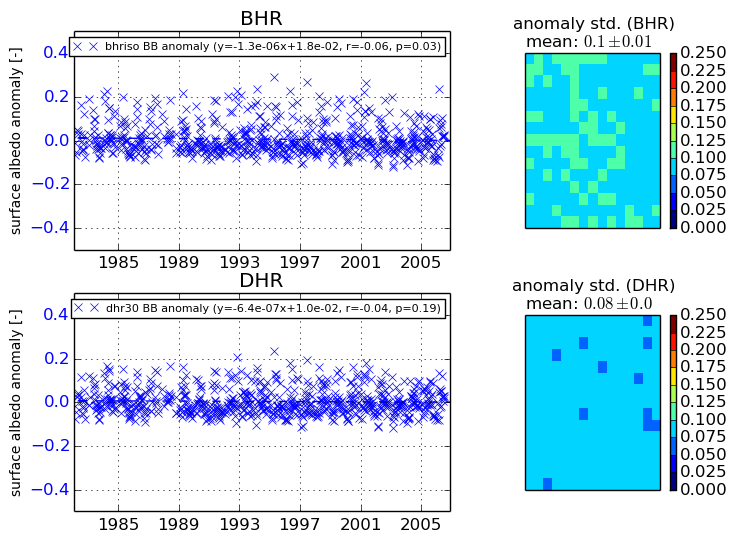
+000 deg


+057/+063 deg