OUJDA


Location

lon / lat [deg]: -1.8985 / 34.6532

Source network: AERONET


Geostationary surface albedo (GSA) data


“+000”


“+057/+063”


Landcover information (based on ESA CCI landcover data)


Landcover fractions @ 2km distance


Landcover fractions @ 20 km distance


Legend


Distance to open water bodies [km]:

31.37

Distance to urban areas [km]:

0.11


Radius: 1 km

Number of landcover classes:

4

Dominant landcover type:

190: urban areas

Fraction of dominant landcover type [%]:

63.0


Radius: 2 km

Number of landcover classes:

4

Dominant landcover type:

190: urban areas

Fraction of dominant landcover type [%]:

63.0


Radius: 5 km

Number of landcover classes:

5

Dominant landcover type:

190: urban areas

Fraction of dominant landcover type [%]:

45.0


Radius: 10 km

Number of landcover classes:

5

Dominant landcover type:

10: cropland, rainfed

Fraction of dominant landcover type [%]:

45.0


Radius: 20 km

Number of landcover classes:

7

Dominant landcover type:

10: cropland, rainfed

Fraction of dominant landcover type [%]:

65.0


Disturbances


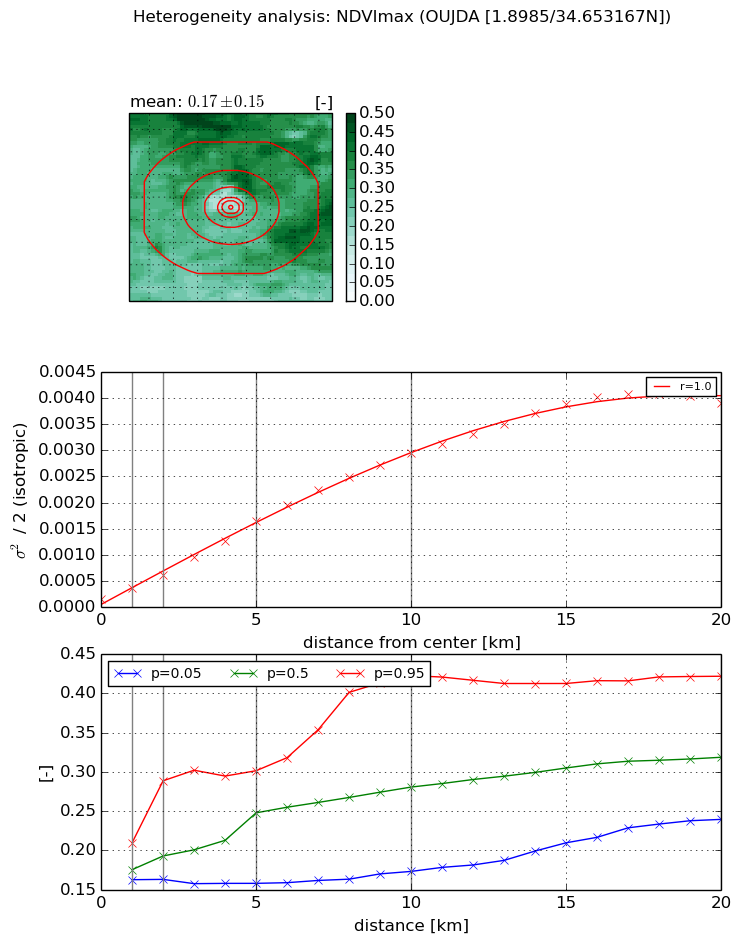
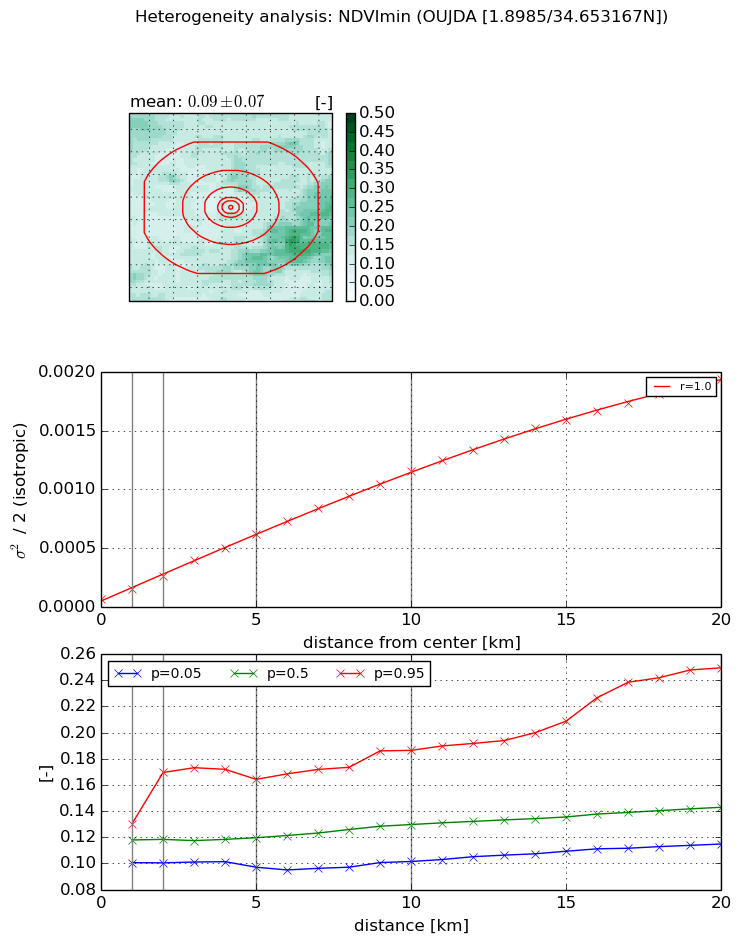
Heterogeneity analysis

The heterogeneity analysis provides information about the spatial and temporal heterogeneity of the site.

Topography


Roman et al. (2009) index


St

3.49737717762

Rcv

0.165719437181

Rse

0.0

Rst

3.76283486482e-08

Rsv

0.692066187886


Height range @ 1km [m]

59

Height range @ 2km [m]

123

Height range @ 5km [m]

179

Height range @ 10km [m]

-999

Height range @ 20km [m]

-999


Variance slope @ 1 km

533

Variance slope @ 2 km

491

Variance slope @ 5 km

612

Variance slope @ 10 km

-999

Variance slope @ 20 km

-999


NDVI (max. NDVI composite)


Roman et al. (2009) index


St

7.47162875946

Rcv

-0.0705406933104

Rse

0.0

Rst

-0.2931660928

Rsv

0.0378120923809


NDVI range @ 1km [-]

0.05

NDVI range @ 2km [-]

0.13

NDVI range @ 5km [-]

0.14

NDVI range @ 10km [-]

0.25

NDVI range @ 20km [-]

0.18


Variance slope @ 1 km

0.000198873127166

Variance slope @ 2 km

0.000224482129998

Variance slope @ 5 km

0.000300260877175

Variance slope @ 10 km

0.000292657155994

Variance slope @ 20 km

0.000208761298926


NDVI (min. NDVI composite)I


Roman et al. (2009) index


St

5.84893789963

Rcv

-0.179002034583

Rse

0.0

Rst

0.0886791488416

Rsv

-0.245232451749


NDVI range @ 1km [-]

0.03

NDVI range @ 2km [-]

0.07

NDVI range @ 5km [-]

0.07

NDVI range @ 10km [-]

0.08

NDVI range @ 20km [-]

0.13


NDVI slope @ 1 km

8.77822403791e-05

NDVI slope @ 2 km

9.55362141527e-05

NDVI slope @ 5 km

0.000112223395791

NDVI slope @ 10 km

0.000110621525259

NDVI slope @ 20 km

9.58246615333e-05


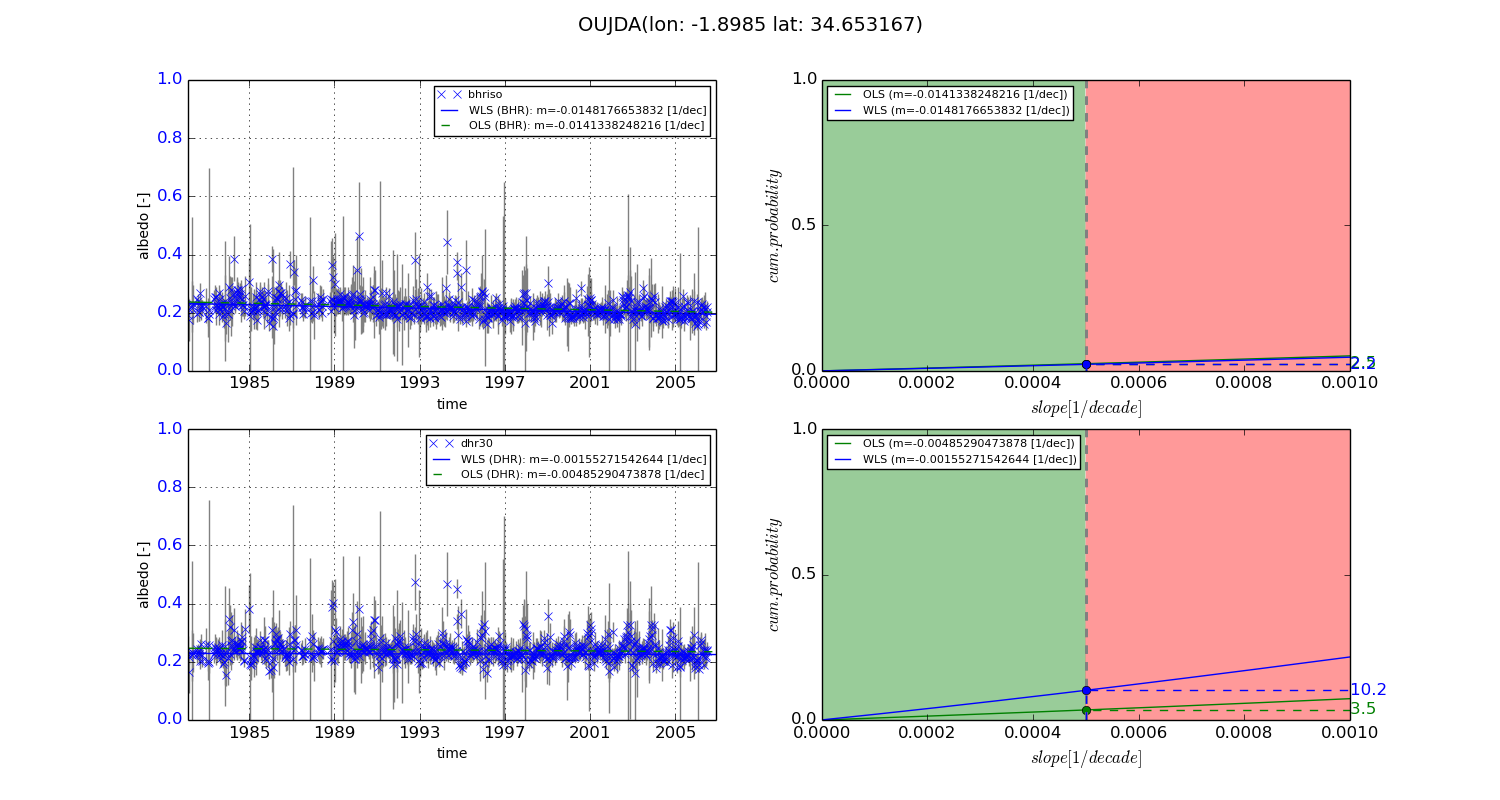
Temporal stability analysis

+000 deg (BHR)


BHR statistics

Temporal stability [1/decade]:


abs

rel


Weighted least square:

-0.0148176653832


Ordinary least square:

-0.0141338248216


Probabilities that GCOS criteria is met:

Weighted least square:

2.2 %

Ordinary least square:

2.5 %


DHR statistics

Temporal stability [1/decade]:


abs

rel


Weighted least square:

-0.00155271542644


Ordinary least square:

-0.00485290473878


Probabilities that GCOS criteria is met:

Weighted least square:

10.2 %

Ordinary least square:

3.5 %


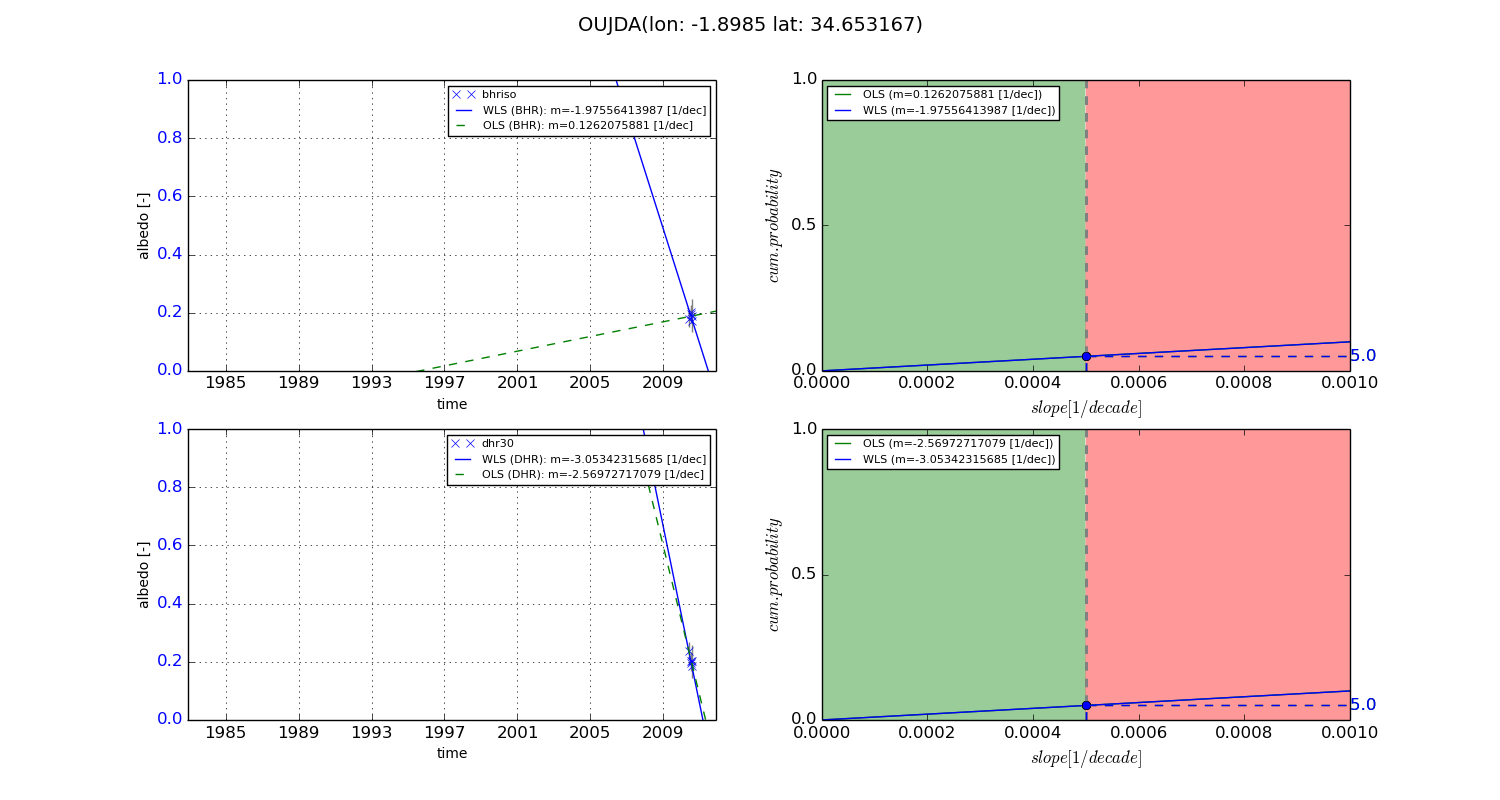
+057/+063 deg (BHR)


BHR statistics

Temporal stability [1/decade]:


abs

rel


Weighted least square:

-1.97556413987


Ordinary least square:

0.1262075881


Probabilities that GCOS criteria is met:

Weighted least square:

5.0 %

Ordinary least square:

5.0 %


DHR statistics

Temporal stability [1/decade]:


abs

rel


Weighted least square:

-3.05342315685


Ordinary least square:

-2.56972717079


Probabilities that GCOS criteria is met:

Weighted least square:

5.0 %

Ordinary least square:

5.0 %


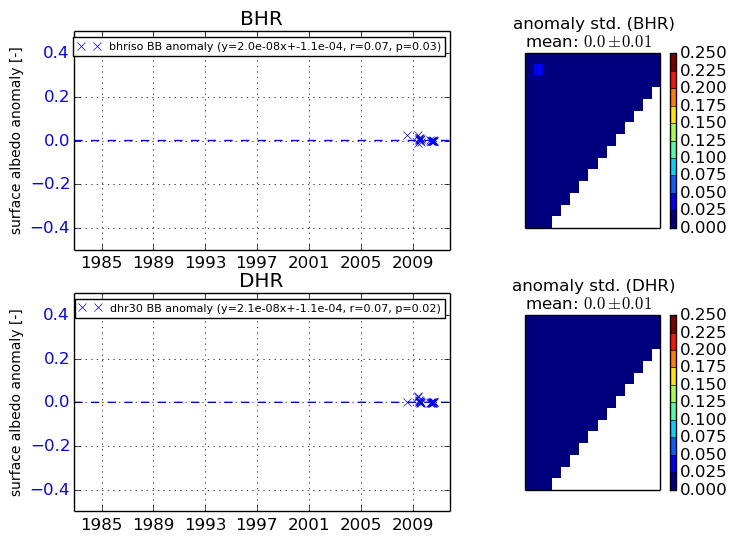
Temporal anomaly analyis

The variance of the temporal anomalies provides an additional measure about the stability of the signal AFTER removal of the mean seasonal cylce.
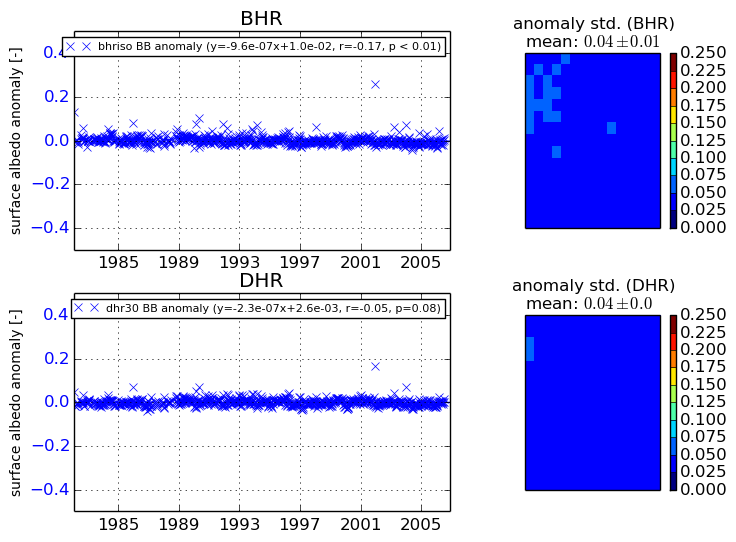
+000 deg


+057/+063 deg