PALGRUNDEN


Location

lon / lat [deg]: 13.1515 / 58.7553

Source network: AERONET


Geostationary surface albedo (GSA) data


“+000”


“+057/+063”


Landcover information (based on ESA CCI landcover data)


Landcover fractions @ 2km distance


Landcover fractions @ 20 km distance


Legend


Distance to open water bodies [km]:

0.13

Distance to urban areas [km]:

20.6


Radius: 1 km

Number of landcover classes:

1

Dominant landcover type:

210: water bodies

Fraction of dominant landcover type [%]:

100.0


Radius: 2 km

Number of landcover classes:

1

Dominant landcover type:

210: water bodies

Fraction of dominant landcover type [%]:

100.0


Radius: 5 km

Number of landcover classes:

1

Dominant landcover type:

210: water bodies

Fraction of dominant landcover type [%]:

100.0


Radius: 10 km

Number of landcover classes:

2

Dominant landcover type:

210: water bodies

Fraction of dominant landcover type [%]:

92.0


Radius: 20 km

Number of landcover classes:

3

Dominant landcover type:

210: water bodies

Fraction of dominant landcover type [%]:

89.0


Disturbances


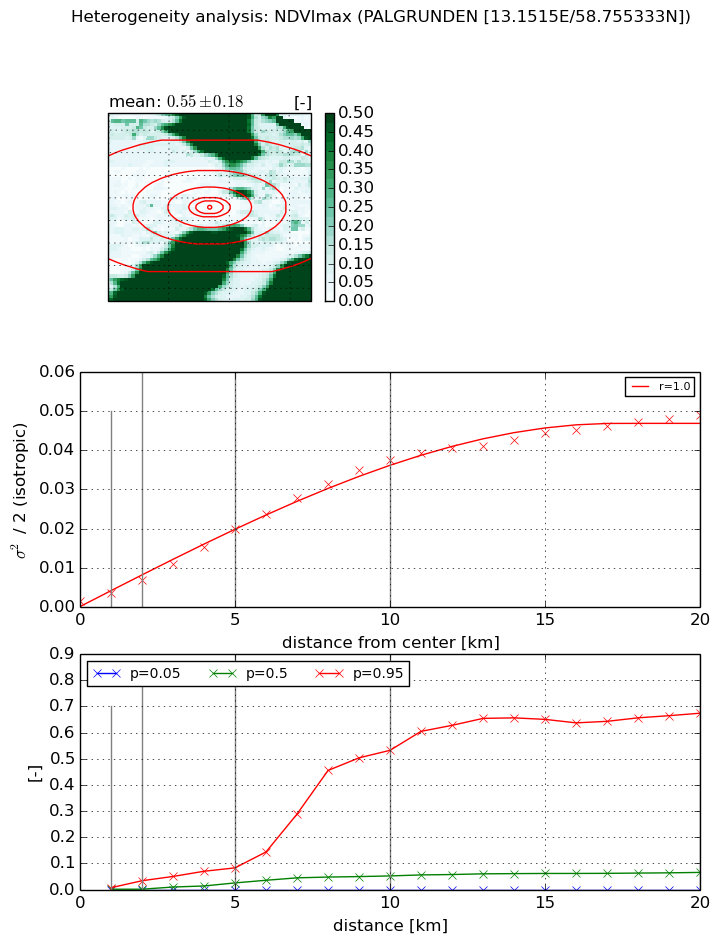
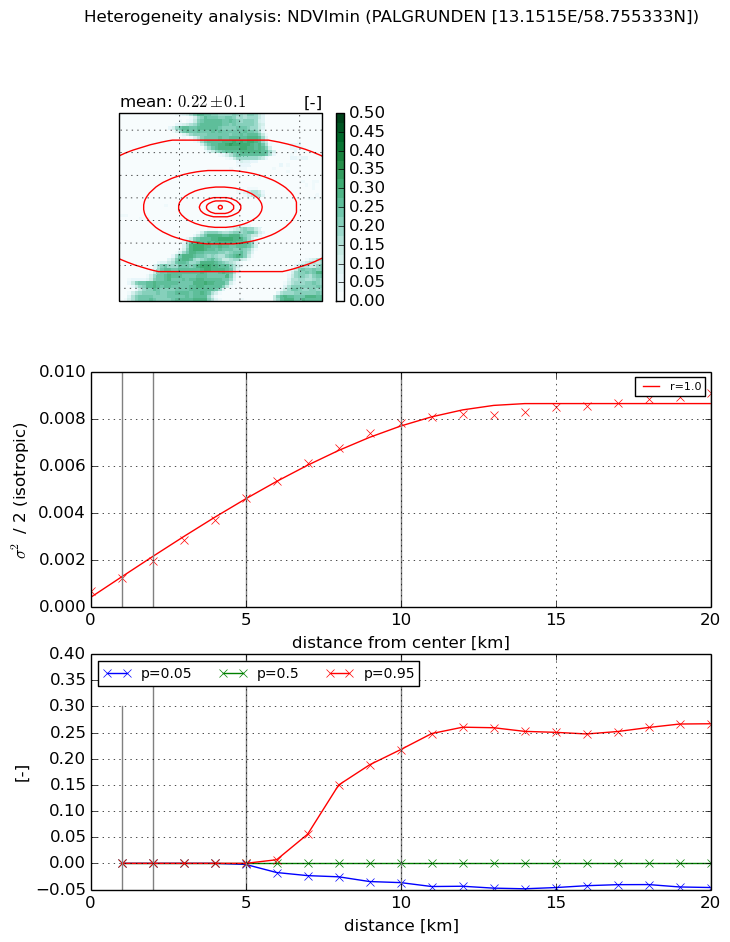
Heterogeneity analysis

The heterogeneity analysis provides information about the spatial and temporal heterogeneity of the site.

Topography


Roman et al. (2009) index


St

nan

Rcv

nan

Rse

nan

Rst

nan

Rsv

nan


Height range @ 1km [m]

0

Height range @ 2km [m]

0

Height range @ 5km [m]

0

Height range @ 10km [m]

-999

Height range @ 20km [m]

-999


Variance slope @ 1 km

0

Variance slope @ 2 km

0

Variance slope @ 5 km

0

Variance slope @ 10 km

-999

Variance slope @ 20 km

-999


NDVI (max. NDVI composite)


Roman et al. (2009) index


St

1.54480225844e-07

Rcv

-0.176876530193

Rse

0.0

Rst

-0.0122417282015

Rsv

19419961.0623


NDVI range @ 1km [-]

0.01

NDVI range @ 2km [-]

0.03

NDVI range @ 5km [-]

0.08

NDVI range @ 10km [-]

0.53

NDVI range @ 20km [-]

0.67


Variance slope @ 1 km

0.0022072501696

Variance slope @ 2 km

0.00268775781946

Variance slope @ 5 km

0.00374256753891

Variance slope @ 10 km

0.00382972600251

Variance slope @ 20 km

0.00244260256686


NDVI (min. NDVI composite)I


Roman et al. (2009) index


St

nan

Rcv

nan

Rse

nan

Rst

nan

Rsv

nan


NDVI range @ 1km [-]

0.0

NDVI range @ 2km [-]

0.0

NDVI range @ 5km [-]

0.0

NDVI range @ 10km [-]

0.25

NDVI range @ 20km [-]

0.31


NDVI slope @ 1 km

0.000543166511945

NDVI slope @ 2 km

0.000631548064769

NDVI slope @ 5 km

0.00080161115417

NDVI slope @ 10 km

0.000754924118094

NDVI slope @ 20 km

0.000414438027142


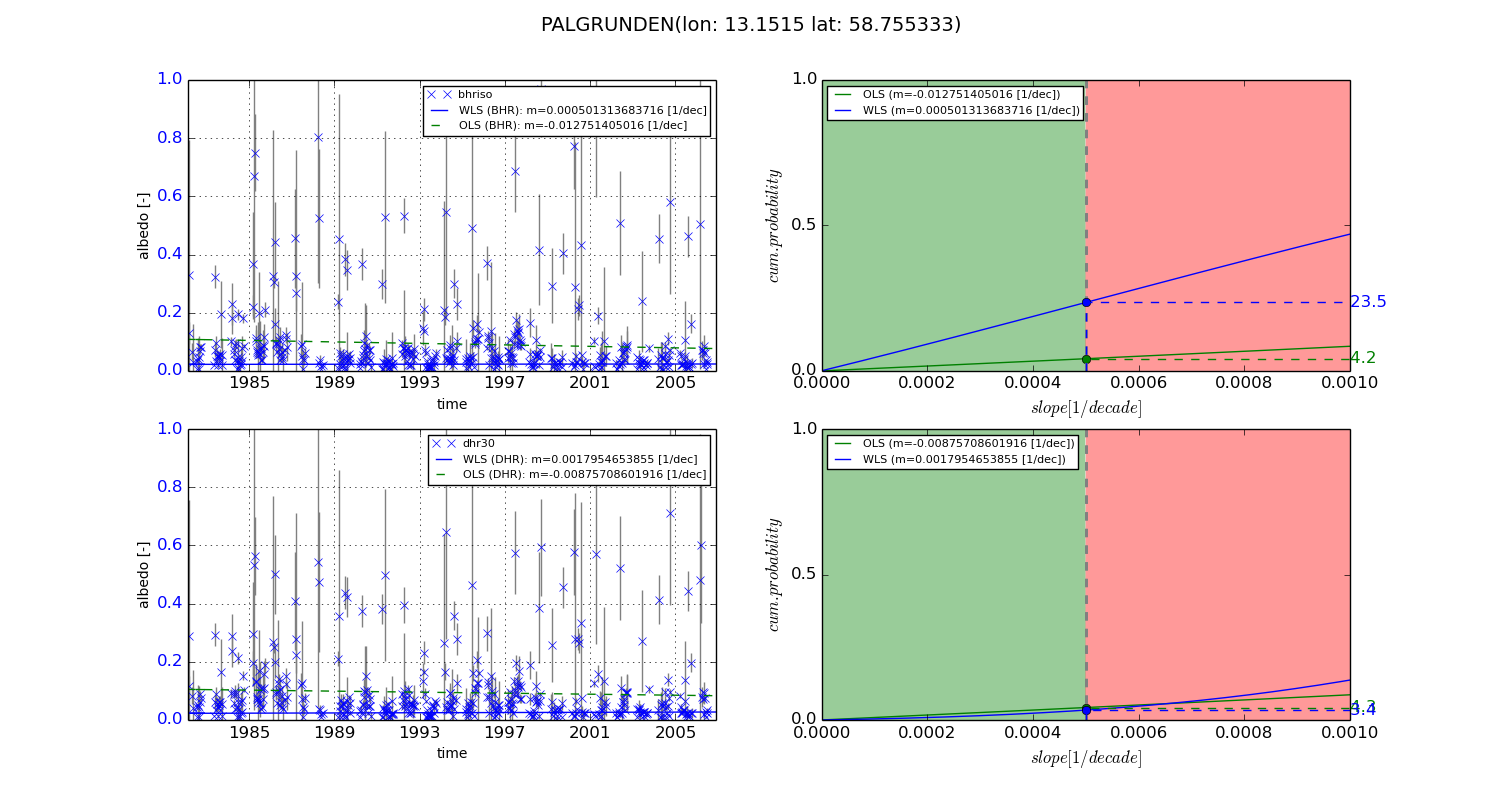
Temporal stability analysis

+000 deg (BHR)


BHR statistics

Temporal stability [1/decade]:


abs

rel


Weighted least square:

0.000501313683716


Ordinary least square:

-0.012751405016


Probabilities that GCOS criteria is met:

Weighted least square:

23.5 %

Ordinary least square:

4.2 %


DHR statistics

Temporal stability [1/decade]:


abs

rel


Weighted least square:

0.0017954653855


Ordinary least square:

-0.00875708601916


Probabilities that GCOS criteria is met:

Weighted least square:

3.4 %

Ordinary least square:

4.3 %


+057/+063 deg (BHR)


BHR statistics

Temporal stability [1/decade]:


abs

rel


Weighted least square:

-99999.0


Ordinary least square:

-99999.0


Probabilities that GCOS criteria is met:

Weighted least square:

-99999.0 %

Ordinary least square:

-99999.0 %


DHR statistics

Temporal stability [1/decade]:


abs

rel


Weighted least square:

-99999.0


Ordinary least square:

-99999.0


Probabilities that GCOS criteria is met:

Weighted least square:

-99999.0 %

Ordinary least square:

-99999.0 %


Temporal anomaly analyis

The variance of the temporal anomalies provides an additional measure about the stability of the signal AFTER removal of the mean seasonal cylce.
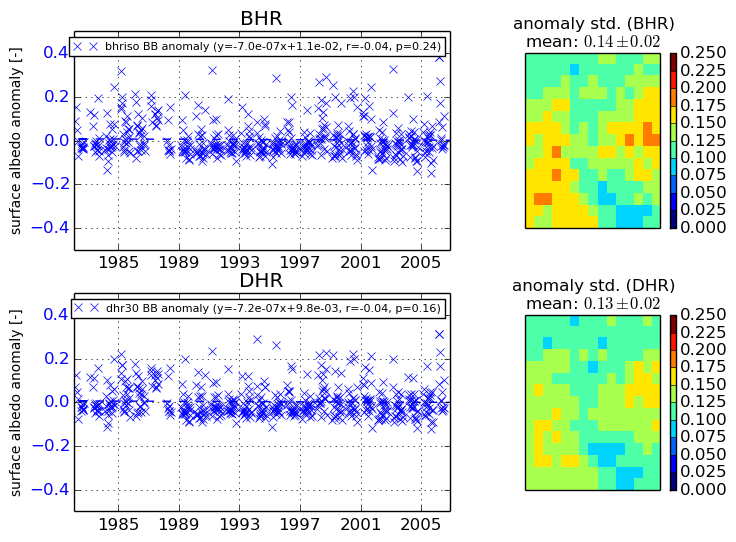
+000 deg


+057/+063 deg