PARK_FALLS


Location

lon / lat [deg]: -90.272 / 45.946

Source network: EOS_LAND


Geostationary surface albedo (GSA) data


“+000”


“+057/+063”


Landcover information (based on ESA CCI landcover data)


Landcover fractions @ 2km distance


Landcover fractions @ 20 km distance


Legend


Distance to open water bodies [km]:

2.97

Distance to urban areas [km]:

9.99


Radius: 1 km

Number of landcover classes:

4

Dominant landcover type:

90: Tree cover, mixed leaf type

Fraction of dominant landcover type [%]:

47.0


Radius: 2 km

Number of landcover classes:

5

Dominant landcover type:

90: Tree cover, mixed leaf type

Fraction of dominant landcover type [%]:

37.0


Radius: 5 km

Number of landcover classes:

6

Dominant landcover type:

160: Tree cover, flooded, fresh or brakish water

Fraction of dominant landcover type [%]:

43.0


Radius: 10 km

Number of landcover classes:

7

Dominant landcover type:

160: Tree cover, flooded, fresh or brakish water

Fraction of dominant landcover type [%]:

41.0


Radius: 20 km

Number of landcover classes:

9

Dominant landcover type:

160: Tree cover, flooded, fresh or brakish water

Fraction of dominant landcover type [%]:

30.0


Disturbances


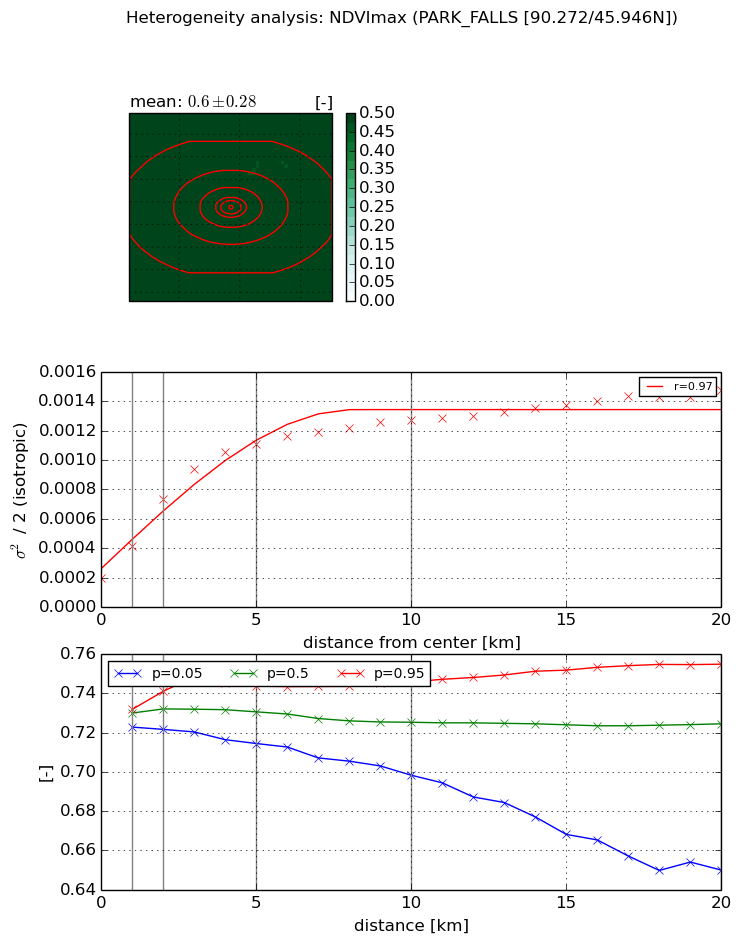
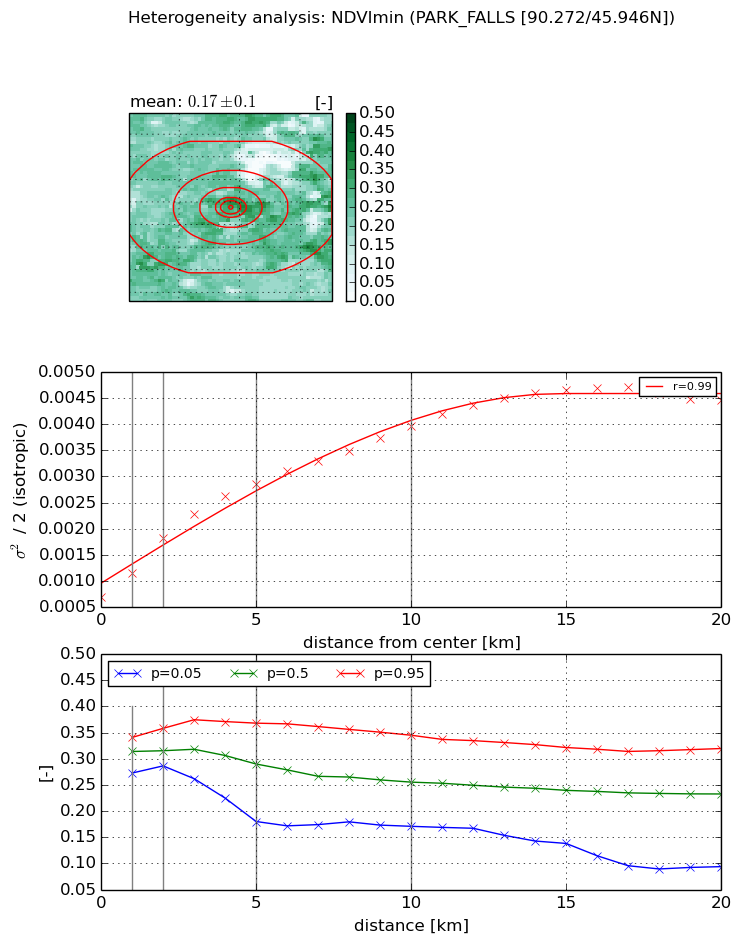
Heterogeneity analysis

The heterogeneity analysis provides information about the spatial and temporal heterogeneity of the site.

Topography


Roman et al. (2009) index


St

4.38557962209

Rcv

0.138355785607

Rse

0.0

Rst

-0.00916866485062

Rsv

-0.536535641597


Height range @ 1km [m]

20

Height range @ 2km [m]

25

Height range @ 5km [m]

30

Height range @ 10km [m]

-999

Height range @ 20km [m]

-999


Variance slope @ 1 km

38

Variance slope @ 2 km

22

Variance slope @ 5 km

12

Variance slope @ 10 km

-999

Variance slope @ 20 km

-999


NDVI (max. NDVI composite)


Roman et al. (2009) index


St

nan

Rcv

nan

Rse

nan

Rst

nan

Rsv

nan


NDVI range @ 1km [-]

0.01

NDVI range @ 2km [-]

0.02

NDVI range @ 5km [-]

0.03

NDVI range @ 10km [-]

0.05

NDVI range @ 20km [-]

0.11


Variance slope @ 1 km

0.000218871748533

Variance slope @ 2 km

0.000269810928678

Variance slope @ 5 km

0.000190761094453

Variance slope @ 10 km

9.83280917009e-05

Variance slope @ 20 km

4.63387369062e-05


NDVI (min. NDVI composite)I


Roman et al. (2009) index


St

2.32813209257e-07

Rcv

0.574208413779

Rse

0.0

Rst

0.210574881398

Rsv

12885865.999


NDVI range @ 1km [-]

0.07

NDVI range @ 2km [-]

0.07

NDVI range @ 5km [-]

0.19

NDVI range @ 10km [-]

0.17

NDVI range @ 20km [-]

0.23


NDVI slope @ 1 km

0.000471450696597

NDVI slope @ 2 km

0.000568406559067

NDVI slope @ 5 km

0.000447884651284

NDVI slope @ 10 km

0.000310817352151

NDVI slope @ 20 km

0.00018180482461


Temporal stability analysis

+000 deg (BHR)


BHR statistics

Temporal stability [1/decade]:


abs

rel


Weighted least square:

None


Ordinary least square:

None


Probabilities that GCOS criteria is met:

Weighted least square:

None %

Ordinary least square:

None %


DHR statistics

Temporal stability [1/decade]:


abs

rel


Weighted least square:

None


Ordinary least square:

None


Probabilities that GCOS criteria is met:

Weighted least square:

None %

Ordinary least square:

None %


+057/+063 deg (BHR)


BHR statistics

Temporal stability [1/decade]:


abs

rel


Weighted least square:

None


Ordinary least square:

None


Probabilities that GCOS criteria is met:

Weighted least square:

None %

Ordinary least square:

None %


DHR statistics

Temporal stability [1/decade]:


abs

rel


Weighted least square:

None


Ordinary least square:

None


Probabilities that GCOS criteria is met:

Weighted least square:

None %

Ordinary least square:

None %


Temporal anomaly analyis

The variance of the temporal anomalies provides an additional measure about the stability of the signal AFTER removal of the mean seasonal cylce.

+000 deg


+057/+063 deg