PIMAI


Location

lon / lat [deg]: 102.5642 / 15.1819

Source network: AERONET


Geostationary surface albedo (GSA) data


“+000”


“+057/+063”


Landcover information (based on ESA CCI landcover data)


Landcover fractions @ 2km distance


Landcover fractions @ 20 km distance


Legend


Distance to open water bodies [km]:

5.78

Distance to urban areas [km]:

5.85


Radius: 1 km

Number of landcover classes:

1

Dominant landcover type:

10: cropland, rainfed

Fraction of dominant landcover type [%]:

100.0


Radius: 2 km

Number of landcover classes:

1

Dominant landcover type:

10: cropland, rainfed

Fraction of dominant landcover type [%]:

100.0


Radius: 5 km

Number of landcover classes:

3

Dominant landcover type:

10: cropland, rainfed

Fraction of dominant landcover type [%]:

97.0


Radius: 10 km

Number of landcover classes:

4

Dominant landcover type:

10: cropland, rainfed

Fraction of dominant landcover type [%]:

81.0


Radius: 20 km

Number of landcover classes:

5

Dominant landcover type:

10: cropland, rainfed

Fraction of dominant landcover type [%]:

69.0


Disturbances


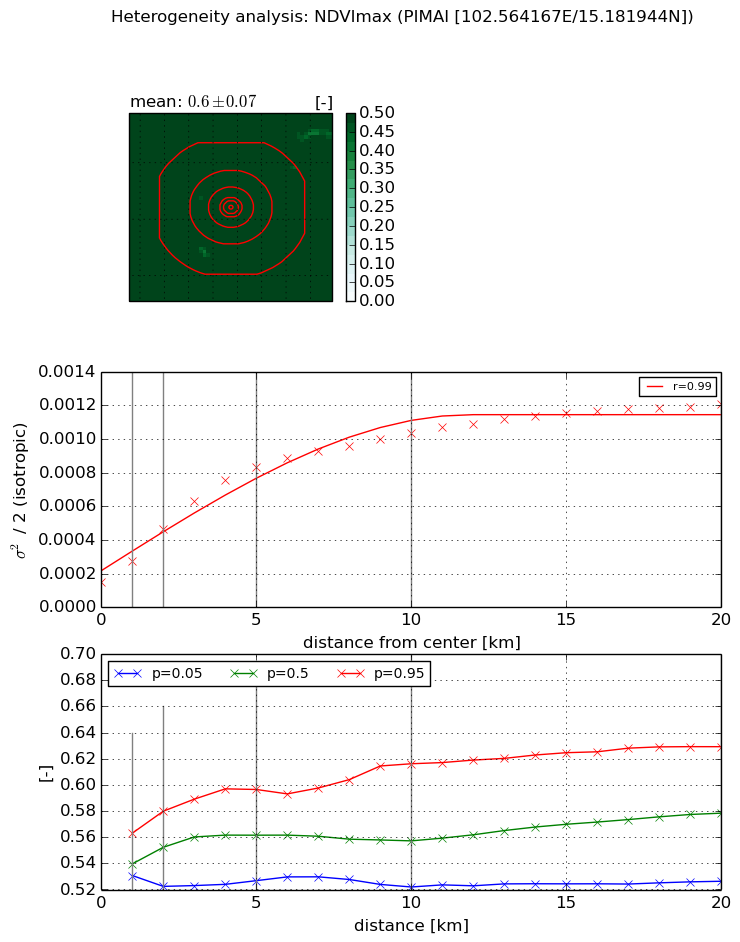
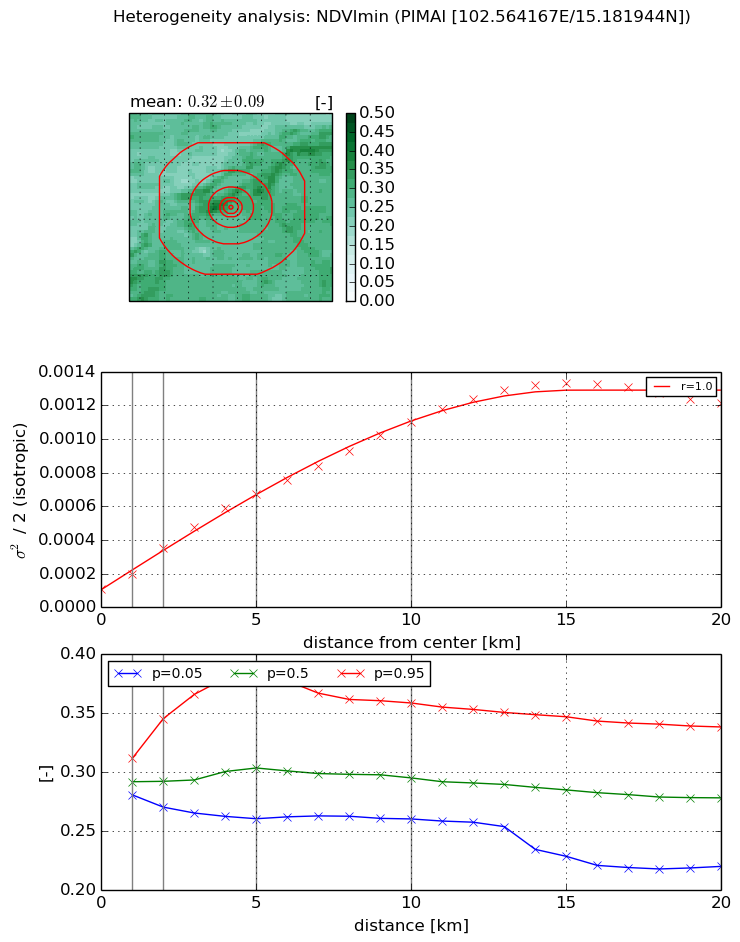
Heterogeneity analysis

The heterogeneity analysis provides information about the spatial and temporal heterogeneity of the site.

Topography


Roman et al. (2009) index


St

3.34356235771e-12

Rcv

0.478148313286

Rse

0.0

Rst

3.42387948948e-06

Rsv

8.97246612756e+11


Height range @ 1km [m]

17

Height range @ 2km [m]

40

Height range @ 5km [m]

85

Height range @ 10km [m]

-999

Height range @ 20km [m]

-999


Variance slope @ 1 km

51

Variance slope @ 2 km

74

Variance slope @ 5 km

130

Variance slope @ 10 km

-999

Variance slope @ 20 km

-999


NDVI (max. NDVI composite)


Roman et al. (2009) index


St

1.65981780472e-06

Rcv

-0.0633330338357

Rse

0.0

Rst

0.391110303174

Rsv

1807426.83755


NDVI range @ 1km [-]

0.03

NDVI range @ 2km [-]

0.06

NDVI range @ 5km [-]

0.07

NDVI range @ 10km [-]

0.09

NDVI range @ 20km [-]

0.1


Variance slope @ 1 km

0.000121336635127

Variance slope @ 2 km

0.000156869148572

Variance slope @ 5 km

0.000143109505336

Variance slope @ 10 km

8.6857676918e-05

Variance slope @ 20 km

4.47567410168e-05


NDVI (min. NDVI composite)I


Roman et al. (2009) index


St

7.34334091744e-07

Rcv

0.150970632813

Rse

0.0

Rst

0.250554739135

Rsv

4085333.55441


NDVI range @ 1km [-]

0.03

NDVI range @ 2km [-]

0.08

NDVI range @ 5km [-]

0.13

NDVI range @ 10km [-]

0.1

NDVI range @ 20km [-]

0.12


NDVI slope @ 1 km

9.42440631146e-05

NDVI slope @ 2 km

0.000121861152671

NDVI slope @ 5 km

0.000117788325054

NDVI slope @ 10 km

9.902265236e-05

NDVI slope @ 20 km

5.94317143515e-05


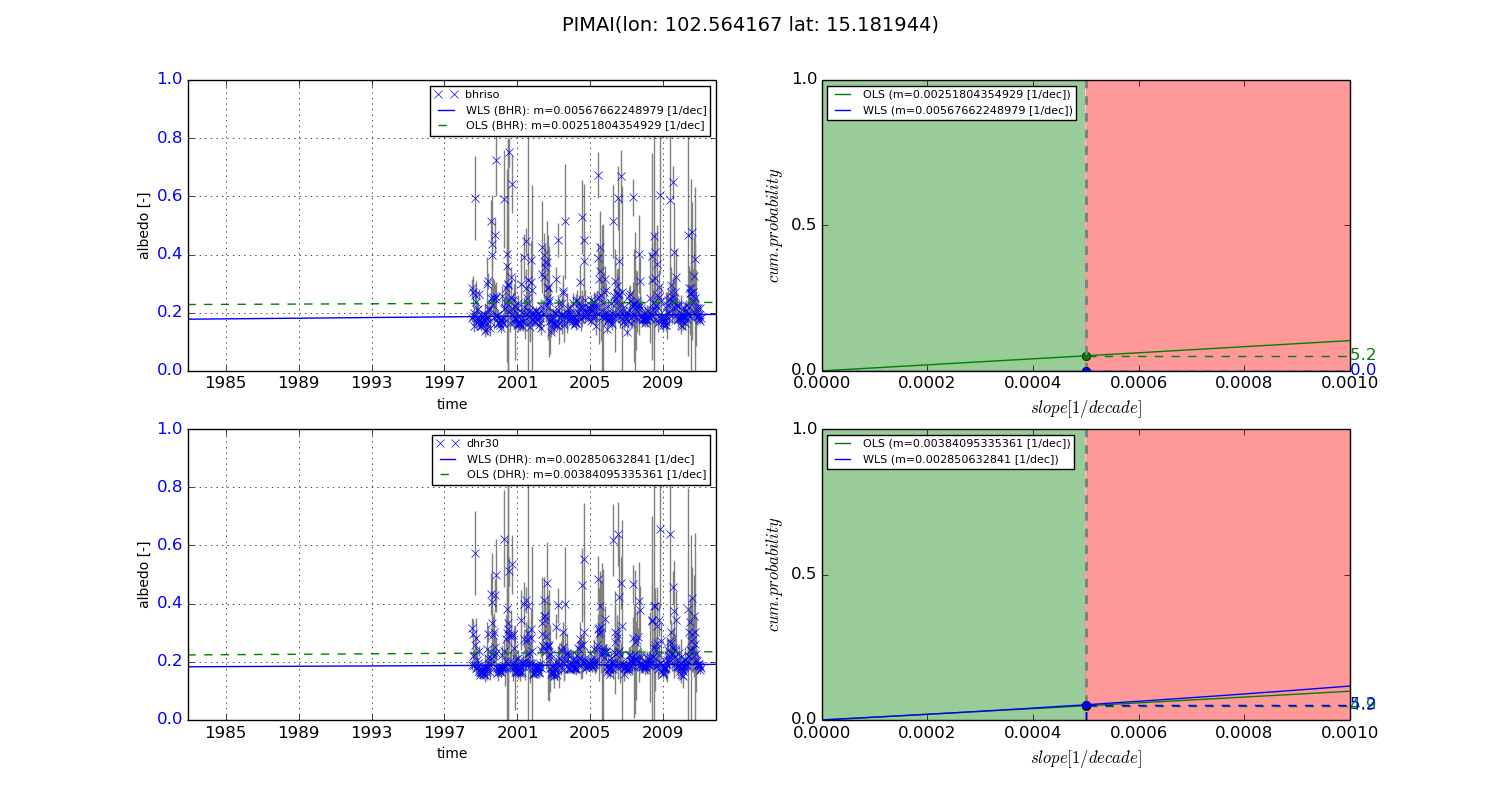
Temporal stability analysis

+000 deg (BHR)


BHR statistics

Temporal stability [1/decade]:


abs

rel


Weighted least square:

None


Ordinary least square:

None


Probabilities that GCOS criteria is met:

Weighted least square:

None %

Ordinary least square:

None %


DHR statistics

Temporal stability [1/decade]:


abs

rel


Weighted least square:

None


Ordinary least square:

None


Probabilities that GCOS criteria is met:

Weighted least square:

None %

Ordinary least square:

None %


+057/+063 deg (BHR)


BHR statistics

Temporal stability [1/decade]:


abs

rel


Weighted least square:

0.00567662248979


Ordinary least square:

0.00251804354929


Probabilities that GCOS criteria is met:

Weighted least square:

0.0 %

Ordinary least square:

5.2 %


DHR statistics

Temporal stability [1/decade]:


abs

rel


Weighted least square:

0.002850632841


Ordinary least square:

0.00384095335361


Probabilities that GCOS criteria is met:

Weighted least square:

5.2 %

Ordinary least square:

4.9 %


Temporal anomaly analyis

The variance of the temporal anomalies provides an additional measure about the stability of the signal AFTER removal of the mean seasonal cylce.

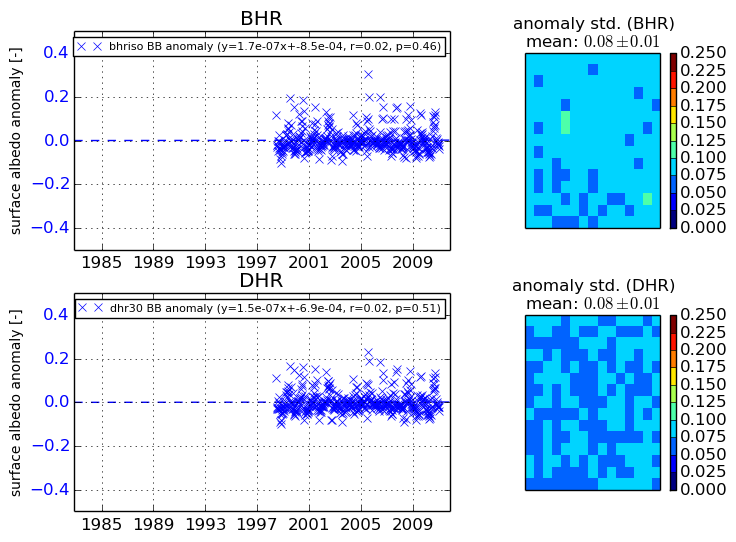
+000 deg


+057/+063 deg