PKU_PEK


Location

lon / lat [deg]: 116.184 / 39.593

Source network: AERONET


Geostationary surface albedo (GSA) data


“+000”


“+057/+063”


Landcover information (based on ESA CCI landcover data)


Landcover fractions @ 2km distance


Landcover fractions @ 20 km distance


Legend


Distance to open water bodies [km]:

15.74

Distance to urban areas [km]:

1.73


Radius: 1 km

Number of landcover classes:

2

Dominant landcover type:

10: cropland, rainfed

Fraction of dominant landcover type [%]:

52.0


Radius: 2 km

Number of landcover classes:

3

Dominant landcover type:

10: cropland, rainfed

Fraction of dominant landcover type [%]:

66.0


Radius: 5 km

Number of landcover classes:

4

Dominant landcover type:

10: cropland, rainfed

Fraction of dominant landcover type [%]:

70.0


Radius: 10 km

Number of landcover classes:

4

Dominant landcover type:

10: cropland, rainfed

Fraction of dominant landcover type [%]:

70.0


Radius: 20 km

Number of landcover classes:

4

Dominant landcover type:

10: cropland, rainfed

Fraction of dominant landcover type [%]:

57.0


Disturbances


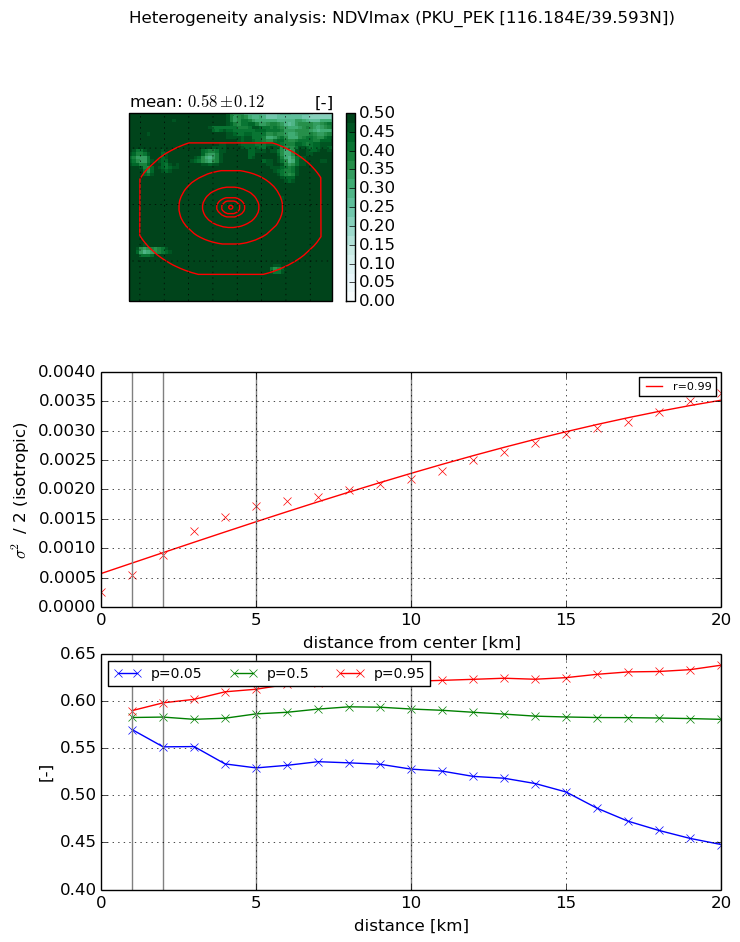
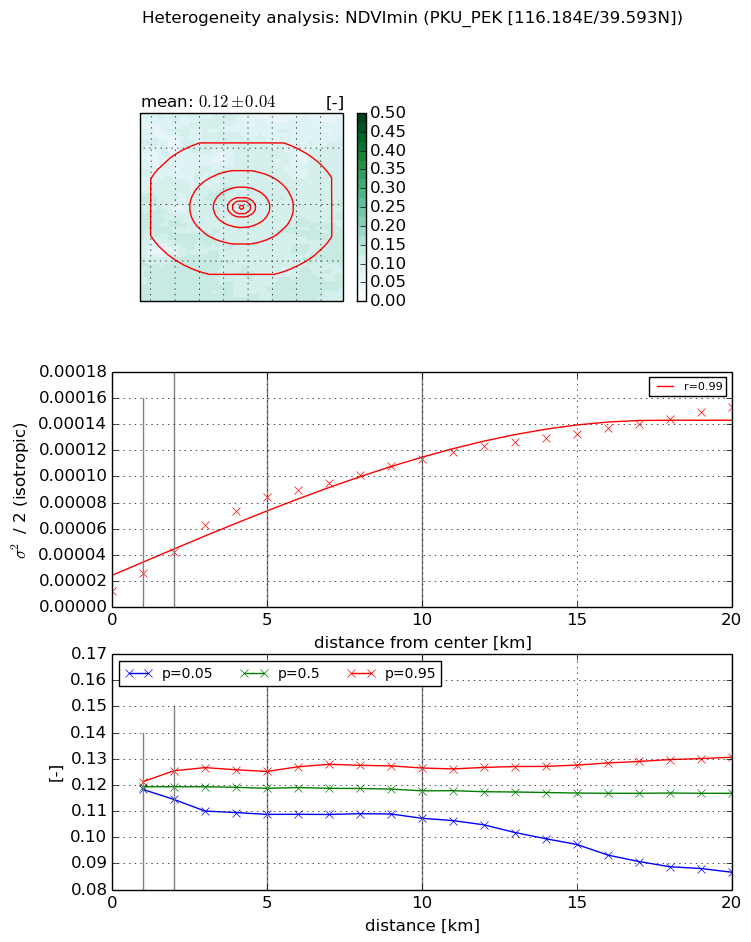
Heterogeneity analysis

The heterogeneity analysis provides information about the spatial and temporal heterogeneity of the site.

Topography


Roman et al. (2009) index


St

0.00256483352374

Rcv

0.311805438736

Rse

0.0

Rst

2.48089977701e-06

Rsv

1169.35475025


Height range @ 1km [m]

5

Height range @ 2km [m]

6

Height range @ 5km [m]

10

Height range @ 10km [m]

-999

Height range @ 20km [m]

-999


Variance slope @ 1 km

2

Variance slope @ 2 km

1

Variance slope @ 5 km

1

Variance slope @ 10 km

-999

Variance slope @ 20 km

-999


NDVI (max. NDVI composite)


Roman et al. (2009) index


St

0.171132605819

Rcv

0.585846728571

Rse

0.0

Rst

1.97446820564e-08

Rsv

16.9444186598


NDVI range @ 1km [-]

0.02

NDVI range @ 2km [-]

0.05

NDVI range @ 5km [-]

0.08

NDVI range @ 10km [-]

0.09

NDVI range @ 20km [-]

0.19


Variance slope @ 1 km

0.000290309726107

Variance slope @ 2 km

0.000312729621981

Variance slope @ 5 km

0.000307140172757

Variance slope @ 10 km

0.000186878991729

Variance slope @ 20 km

0.000149936117634


NDVI (min. NDVI composite)I


Roman et al. (2009) index


St

3.34067570449

Rcv

0.143240841299

Rse

0.0

Rst

-6.61130859473e-08

Rsv

-0.754781009521


NDVI range @ 1km [-]

0.0

NDVI range @ 2km [-]

0.01

NDVI range @ 5km [-]

0.02

NDVI range @ 10km [-]

0.02

NDVI range @ 20km [-]

0.04


NDVI slope @ 1 km

1.3996377485e-05

NDVI slope @ 2 km

1.51074599692e-05

NDVI slope @ 5 km

1.49257119456e-05

NDVI slope @ 10 km

9.92356465697e-06

NDVI slope @ 20 km

6.23708890939e-06


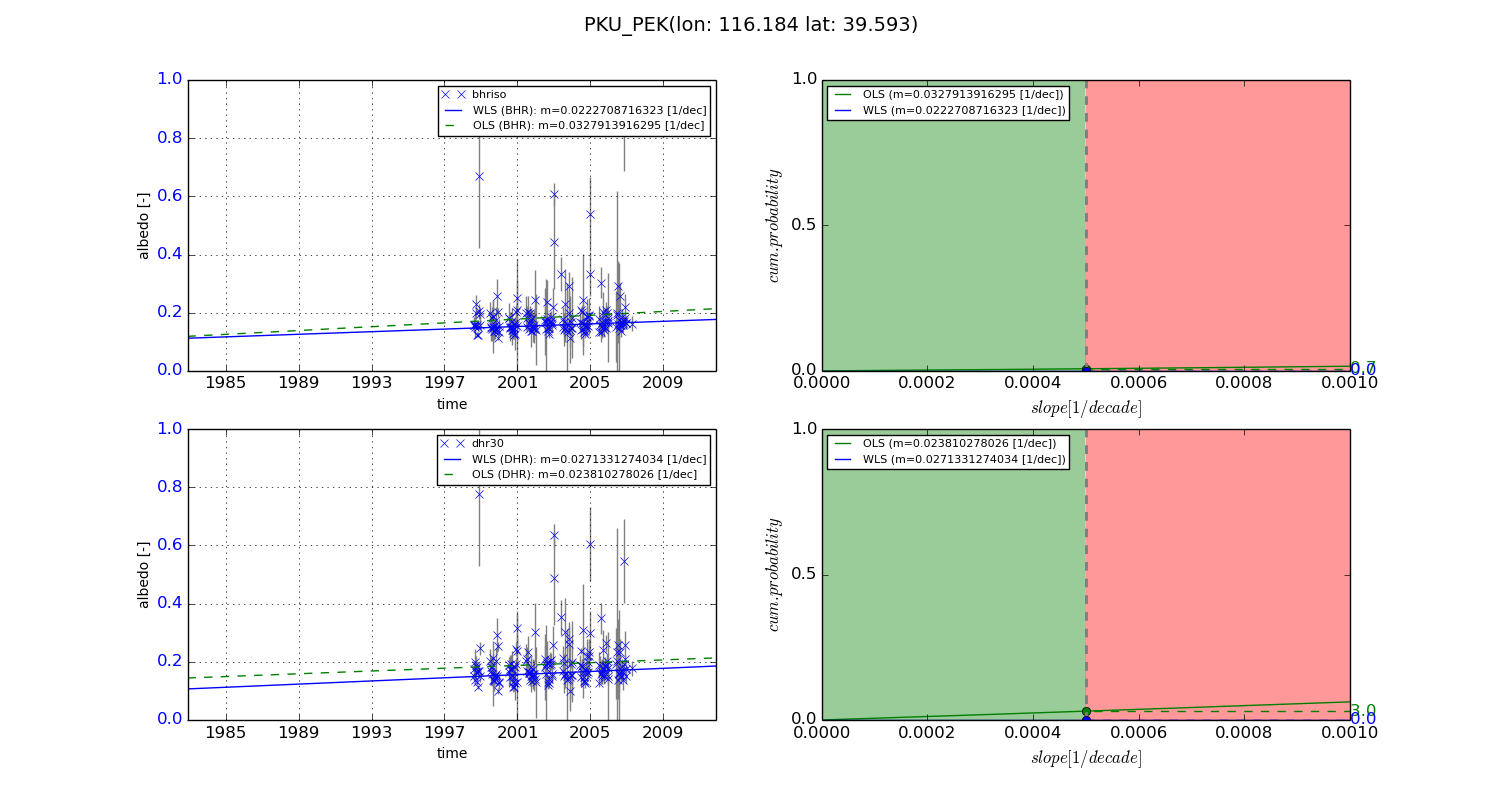
Temporal stability analysis

+000 deg (BHR)


BHR statistics

Temporal stability [1/decade]:


abs

rel


Weighted least square:

None


Ordinary least square:

None


Probabilities that GCOS criteria is met:

Weighted least square:

None %

Ordinary least square:

None %


DHR statistics

Temporal stability [1/decade]:


abs

rel


Weighted least square:

None


Ordinary least square:

None


Probabilities that GCOS criteria is met:

Weighted least square:

None %

Ordinary least square:

None %


+057/+063 deg (BHR)


BHR statistics

Temporal stability [1/decade]:


abs

rel


Weighted least square:

0.0222708716323


Ordinary least square:

0.0327913916295


Probabilities that GCOS criteria is met:

Weighted least square:

0.0 %

Ordinary least square:

0.7 %


DHR statistics

Temporal stability [1/decade]:


abs

rel


Weighted least square:

0.0271331274034


Ordinary least square:

0.023810278026


Probabilities that GCOS criteria is met:

Weighted least square:

0.0 %

Ordinary least square:

3.0 %


Temporal anomaly analyis

The variance of the temporal anomalies provides an additional measure about the stability of the signal AFTER removal of the mean seasonal cylce.

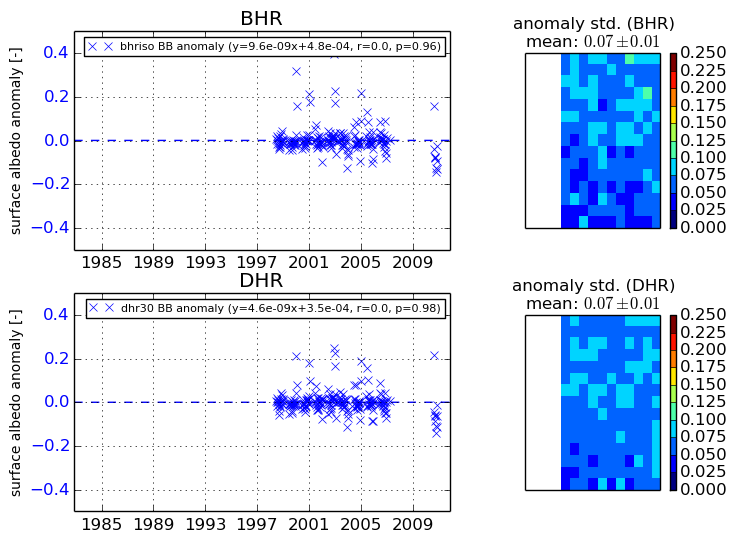
+000 deg


+057/+063 deg