PL-WET


Location

lon / lat [deg]: 16.3094 / 52.7622

Source network: FLUXNET


Geostationary surface albedo (GSA) data


“+000”


“+057/+063”


Landcover information (based on ESA CCI landcover data)


Landcover fractions @ 2km distance


Landcover fractions @ 20 km distance


Legend


Distance to open water bodies [km]:

0.21

Distance to urban areas [km]:

5.98


Radius: 1 km

Number of landcover classes:

5

Dominant landcover type:

70: Tree cover, needleleaved, evergreen, closed to open (>15%)

Fraction of dominant landcover type [%]:

56.0


Radius: 2 km

Number of landcover classes:

5

Dominant landcover type:

70: Tree cover, needleleaved, evergreen, closed to open (>15%)

Fraction of dominant landcover type [%]:

84.0


Radius: 5 km

Number of landcover classes:

4

Dominant landcover type:

70: Tree cover, needleleaved, evergreen, closed to open (>15%)

Fraction of dominant landcover type [%]:

94.0


Radius: 10 km

Number of landcover classes:

4

Dominant landcover type:

70: Tree cover, needleleaved, evergreen, closed to open (>15%)

Fraction of dominant landcover type [%]:

77.0


Radius: 20 km

Number of landcover classes:

7

Dominant landcover type:

70: Tree cover, needleleaved, evergreen, closed to open (>15%)

Fraction of dominant landcover type [%]:

52.0


Disturbances


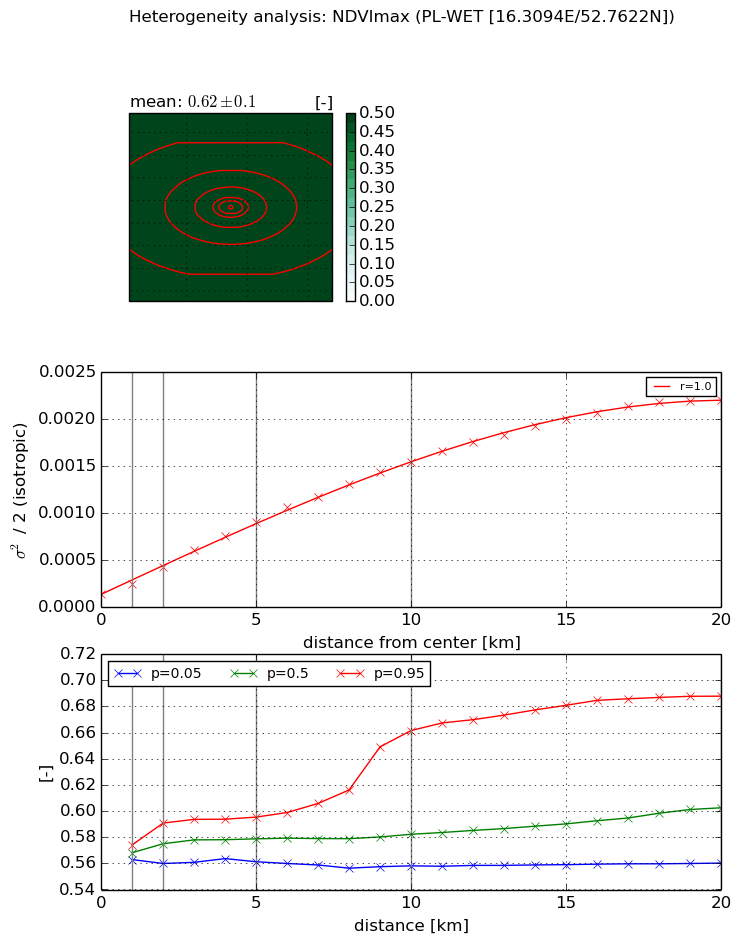
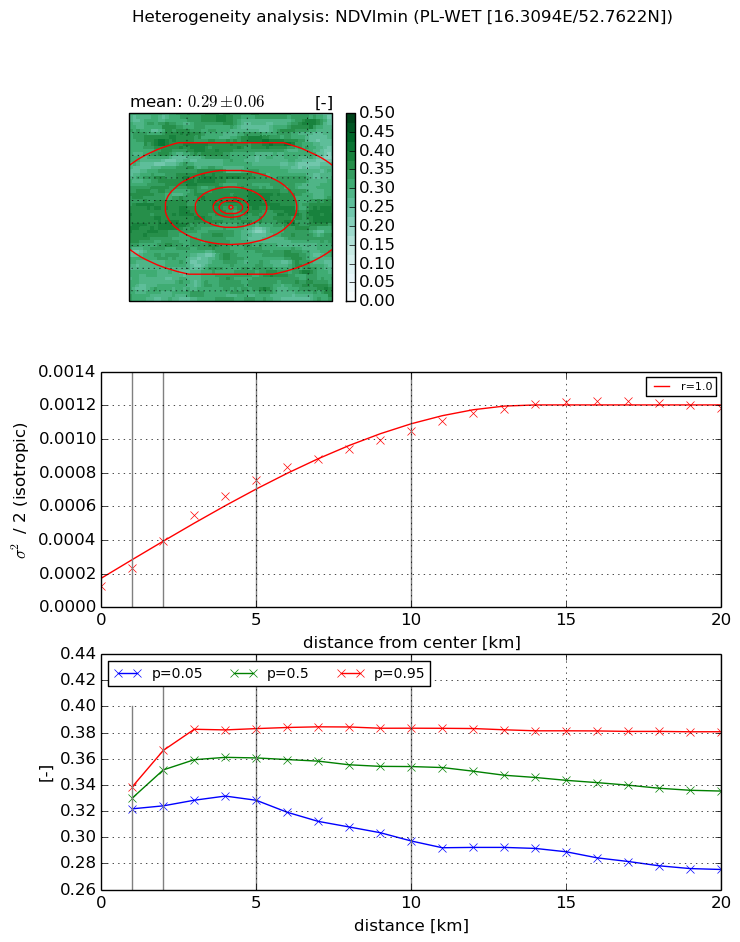
Heterogeneity analysis

The heterogeneity analysis provides information about the spatial and temporal heterogeneity of the site.

Topography


Roman et al. (2009) index


St

6.05747943278

Rcv

-0.0319181854869

Rse

0.0

Rst

-0.0797203709943

Rsv

0.383616942657


Height range @ 1km [m]

18

Height range @ 2km [m]

28

Height range @ 5km [m]

27

Height range @ 10km [m]

-999

Height range @ 20km [m]

-999


Variance slope @ 1 km

32

Variance slope @ 2 km

26

Variance slope @ 5 km

13

Variance slope @ 10 km

-999

Variance slope @ 20 km

-999


NDVI (max. NDVI composite)


Roman et al. (2009) index


St

1.86719572233

Rcv

0.0893944400709

Rse

0.0

Rst

-0.517293143164

Rsv

-0.999999902237


NDVI range @ 1km [-]

0.01

NDVI range @ 2km [-]

0.03

NDVI range @ 5km [-]

0.03

NDVI range @ 10km [-]

0.1

NDVI range @ 20km [-]

0.13


Variance slope @ 1 km

0.000112661447035

Variance slope @ 2 km

0.000143125616586

Variance slope @ 5 km

0.000159283847055

Variance slope @ 10 km

0.000143758607562

Variance slope @ 20 km

0.000107450241308


NDVI (min. NDVI composite)I


Roman et al. (2009) index


St

0.761347158074

Rcv

-0.0035392409145

Rse

0.0

Rst

-0.386682023334

Rsv

3.55016252544


NDVI range @ 1km [-]

0.02

NDVI range @ 2km [-]

0.04

NDVI range @ 5km [-]

0.05

NDVI range @ 10km [-]

0.09

NDVI range @ 20km [-]

0.11


NDVI slope @ 1 km

0.000109806805588

NDVI slope @ 2 km

0.00013300143241

NDVI slope @ 5 km

0.000131289516448

NDVI slope @ 10 km

9.21990206915e-05

NDVI slope @ 20 km

5.09731487438e-05


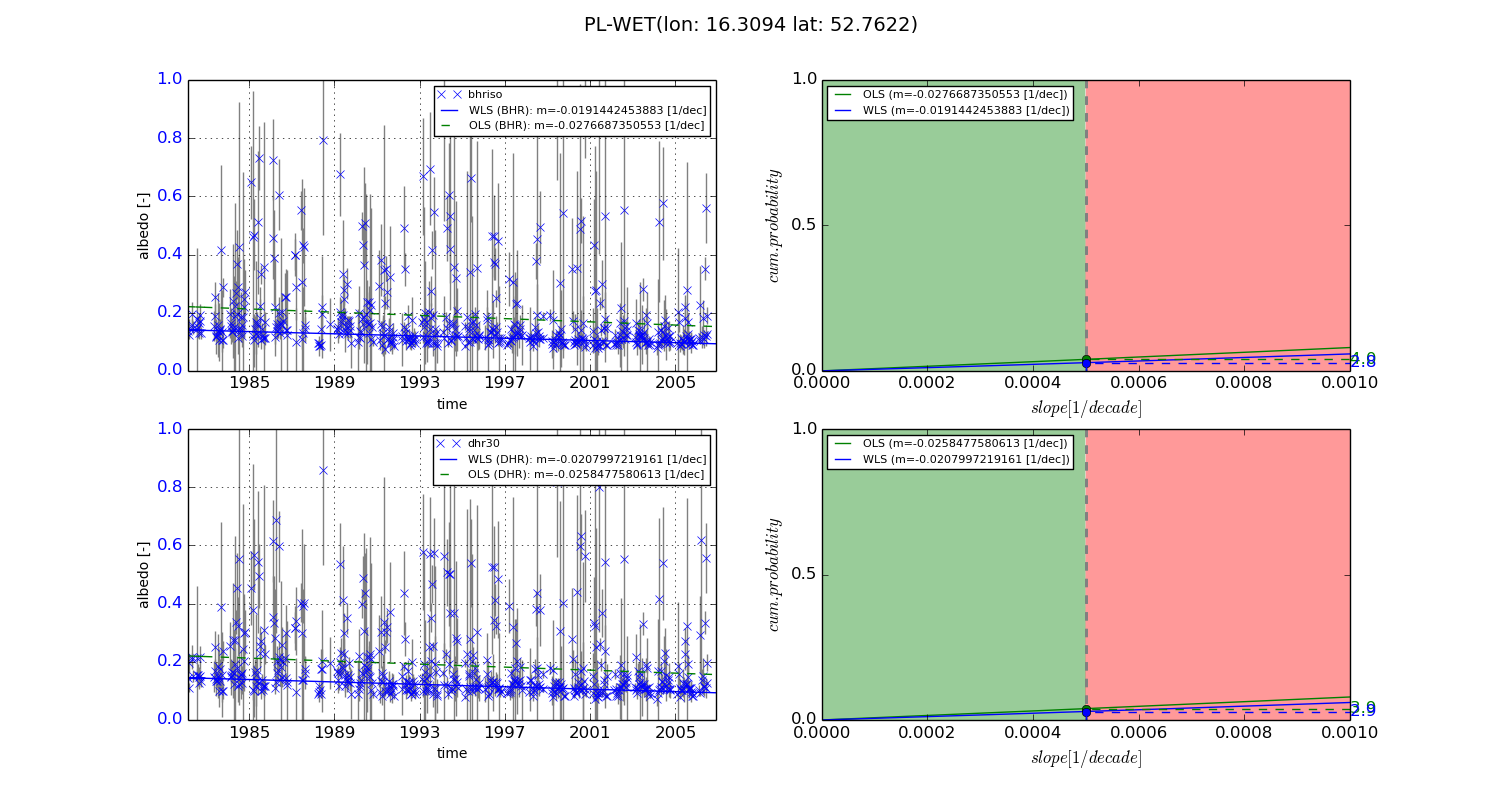
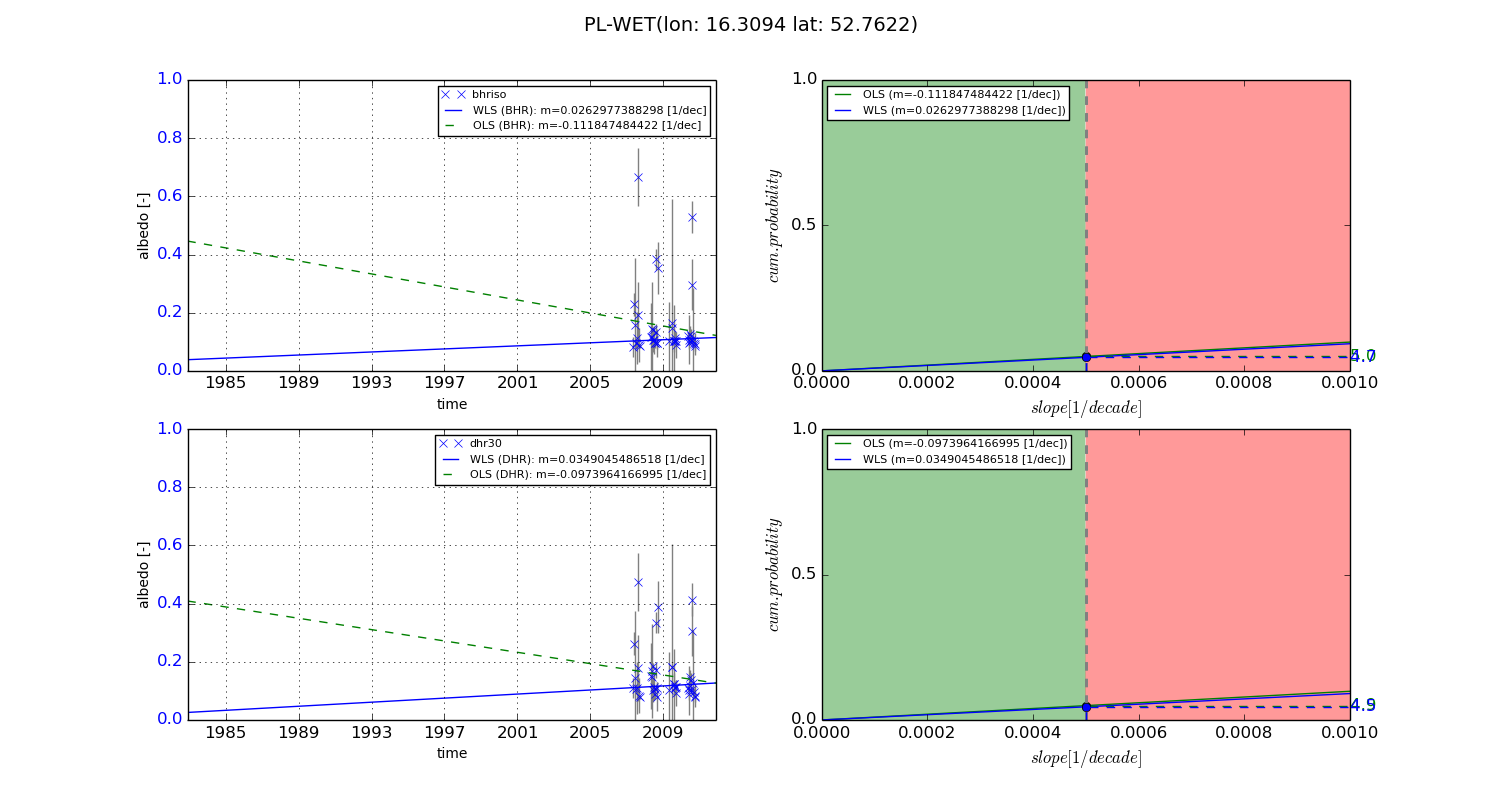
Temporal stability analysis

+000 deg (BHR)


BHR statistics

Temporal stability [1/decade]:


abs

rel


Weighted least square:

-0.0191442453883


Ordinary least square:

-0.0276687350553


Probabilities that GCOS criteria is met:

Weighted least square:

2.8 %

Ordinary least square:

4.0 %


DHR statistics

Temporal stability [1/decade]:


abs

rel


Weighted least square:

-0.0207997219161


Ordinary least square:

-0.0258477580613


Probabilities that GCOS criteria is met:

Weighted least square:

2.9 %

Ordinary least square:

3.9 %


+057/+063 deg (BHR)


BHR statistics

Temporal stability [1/decade]:


abs

rel


Weighted least square:

0.0262977388298


Ordinary least square:

-0.111847484422


Probabilities that GCOS criteria is met:

Weighted least square:

4.7 %

Ordinary least square:

5.0 %


DHR statistics

Temporal stability [1/decade]:


abs

rel


Weighted least square:

0.0349045486518


Ordinary least square:

-0.0973964166995


Probabilities that GCOS criteria is met:

Weighted least square:

4.5 %

Ordinary least square:

4.9 %


Temporal anomaly analyis

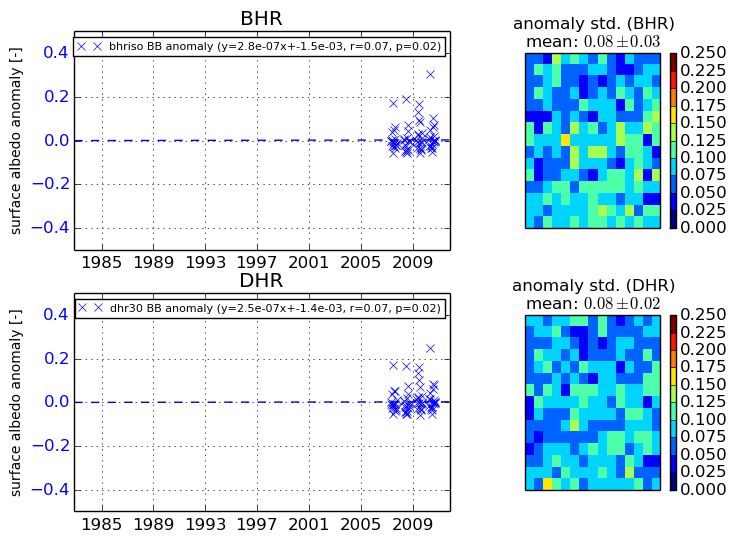
The variance of the temporal anomalies provides an additional measure about the stability of the signal AFTER removal of the mean seasonal cylce.
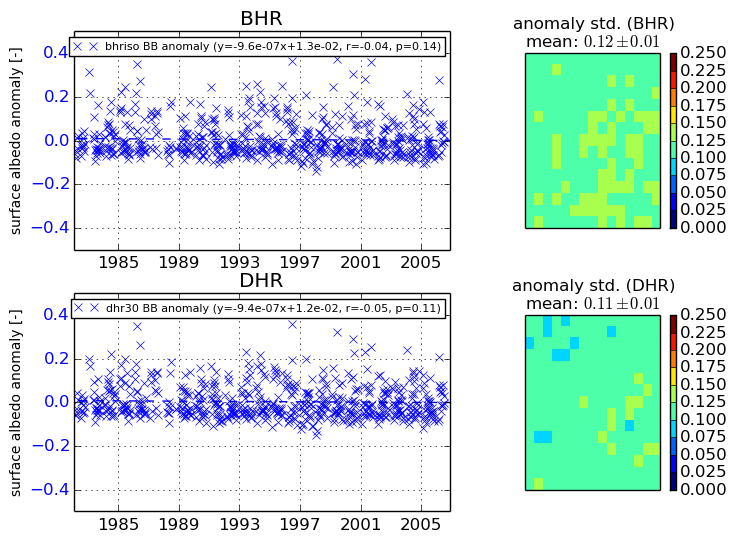
+000 deg


+057/+063 deg