PT-MI1


Location

lon / lat [deg]: -8.0004 / 38.5407

Source network: FLUXNET


Geostationary surface albedo (GSA) data


“+000”


“+057/+063”


Landcover information (based on ESA CCI landcover data)


Landcover fractions @ 2km distance


Landcover fractions @ 20 km distance


Legend


Distance to open water bodies [km]:

4.02

Distance to urban areas [km]:

1.83


Radius: 1 km

Number of landcover classes:

2

Dominant landcover type:

10: cropland, rainfed

Fraction of dominant landcover type [%]:

91.0


Radius: 2 km

Number of landcover classes:

2

Dominant landcover type:

10: cropland, rainfed

Fraction of dominant landcover type [%]:

92.0


Radius: 5 km

Number of landcover classes:

7

Dominant landcover type:

10: cropland, rainfed

Fraction of dominant landcover type [%]:

81.0


Radius: 10 km

Number of landcover classes:

8

Dominant landcover type:

10: cropland, rainfed

Fraction of dominant landcover type [%]:

75.0


Radius: 20 km

Number of landcover classes:

7

Dominant landcover type:

10: cropland, rainfed

Fraction of dominant landcover type [%]:

79.0


Disturbances


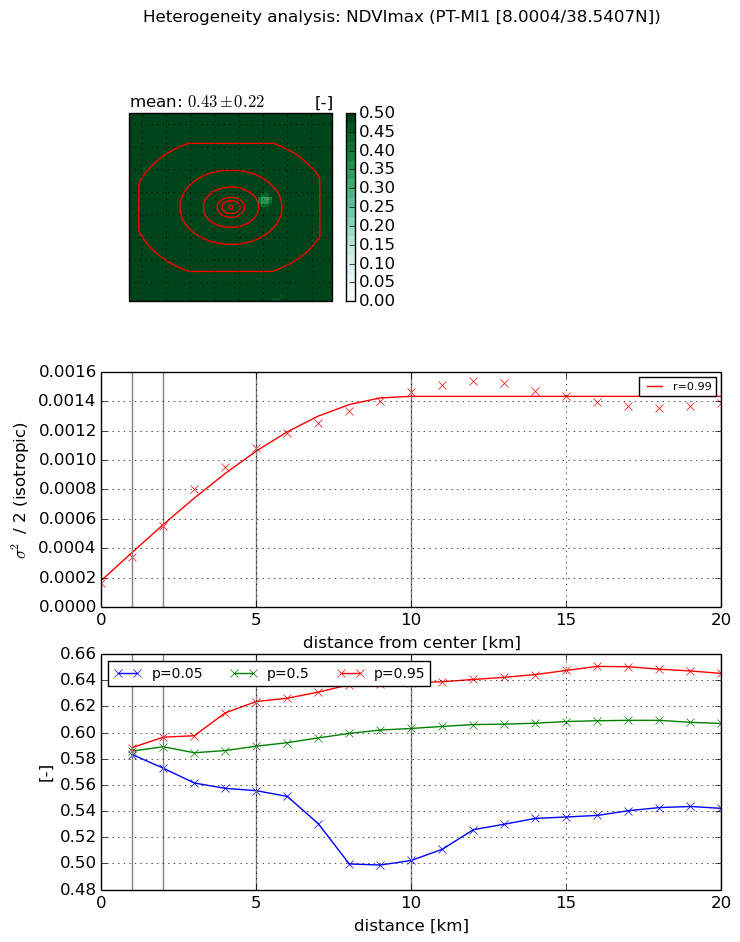
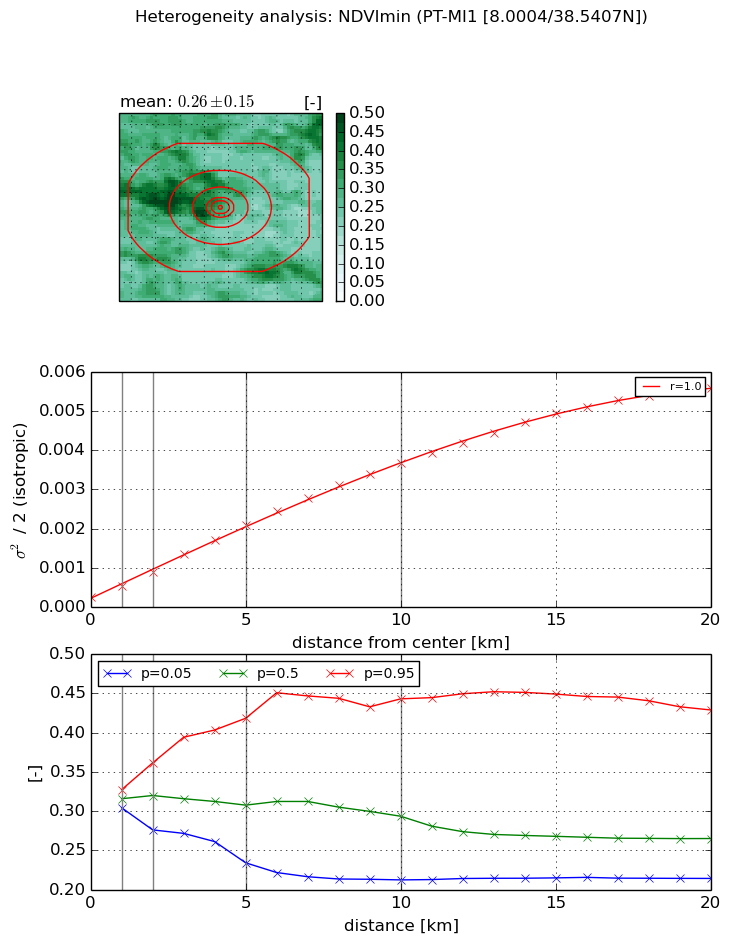
Heterogeneity analysis

The heterogeneity analysis provides information about the spatial and temporal heterogeneity of the site.

Topography


Roman et al. (2009) index


St

8.31135725179e-07

Rcv

1.12932760578

Rse

0.0

Rst

-0.00876530416883

Rsv

3609517.63137


Height range @ 1km [m]

28

Height range @ 2km [m]

33

Height range @ 5km [m]

116

Height range @ 10km [m]

-999

Height range @ 20km [m]

-999


Variance slope @ 1 km

279

Variance slope @ 2 km

326

Variance slope @ 5 km

304

Variance slope @ 10 km

-999

Variance slope @ 20 km

-999


NDVI (max. NDVI composite)


Roman et al. (2009) index


St

1.81361149293

Rcv

0.647576017071

Rse

0.0

Rst

-0.231078987405

Rsv

0.77550301762


NDVI range @ 1km [-]

0.01

NDVI range @ 2km [-]

0.02

NDVI range @ 5km [-]

0.07

NDVI range @ 10km [-]

0.14

NDVI range @ 20km [-]

0.1


Variance slope @ 1 km

0.000180537411735

Variance slope @ 2 km

0.000195123229117

Variance slope @ 5 km

0.000190735155211

Variance slope @ 10 km

0.000128969694802

Variance slope @ 20 km

5.04013415042e-05


NDVI (min. NDVI composite)I


Roman et al. (2009) index


St

1.07484959216e-07

Rcv

0.583744460182

Rse

0.0

Rst

0.112697514358

Rsv

27910881.1784


NDVI range @ 1km [-]

0.02

NDVI range @ 2km [-]

0.09

NDVI range @ 5km [-]

0.18

NDVI range @ 10km [-]

0.23

NDVI range @ 20km [-]

0.21


NDVI slope @ 1 km

0.000289357349758

NDVI slope @ 2 km

0.00032438041399

NDVI slope @ 5 km

0.000377282459329

NDVI slope @ 10 km

0.000351974785213

NDVI slope @ 20 km

0.000276661068226


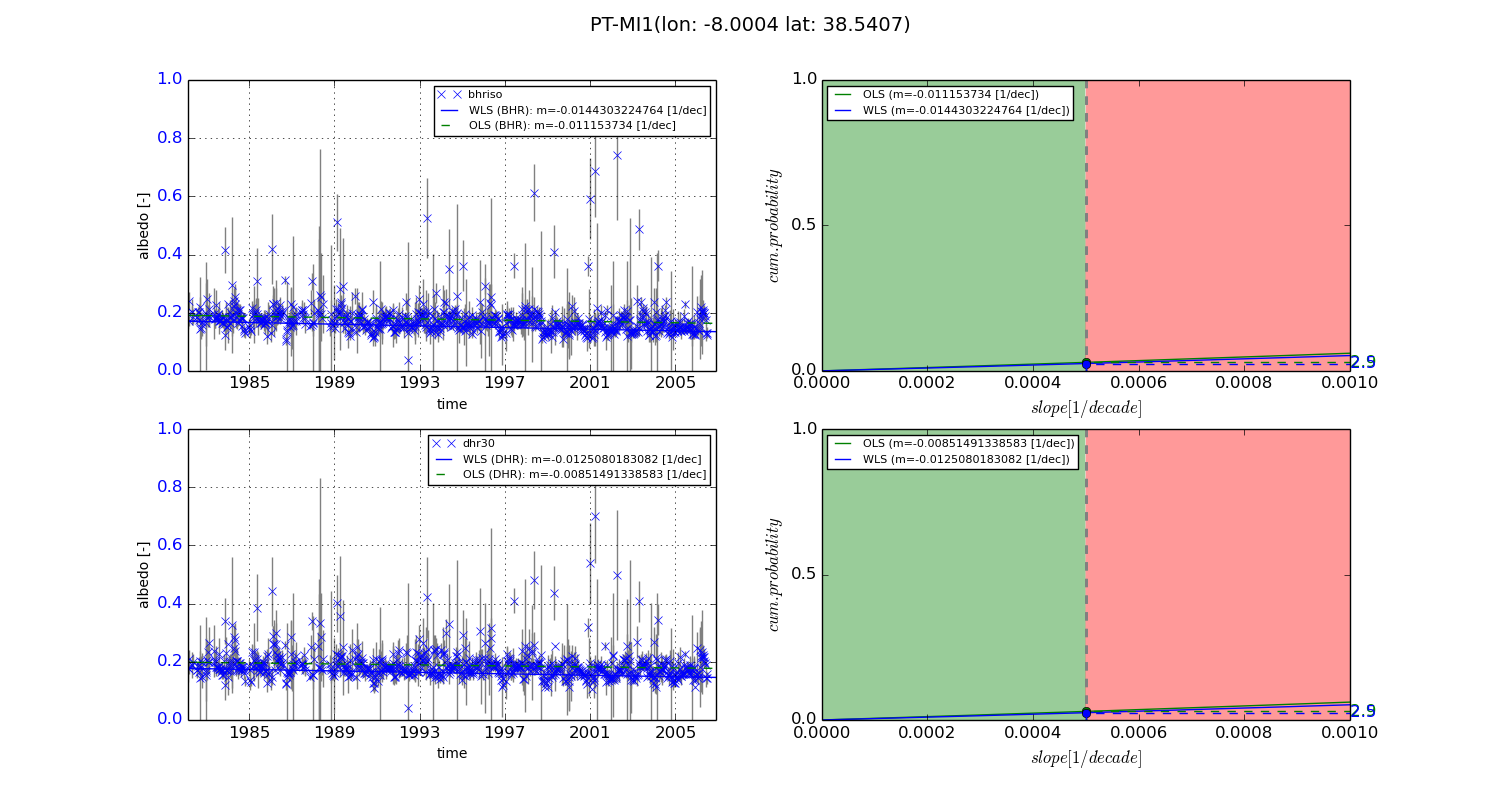
Temporal stability analysis

+000 deg (BHR)


BHR statistics

Temporal stability [1/decade]:


abs

rel


Weighted least square:

-0.0144303224764


Ordinary least square:

-0.011153734


Probabilities that GCOS criteria is met:

Weighted least square:

2.5 %

Ordinary least square:

2.9 %


DHR statistics

Temporal stability [1/decade]:


abs

rel


Weighted least square:

-0.0125080183082


Ordinary least square:

-0.00851491338583


Probabilities that GCOS criteria is met:

Weighted least square:

2.5 %

Ordinary least square:

2.9 %


+057/+063 deg (BHR)


BHR statistics

Temporal stability [1/decade]:


abs

rel


Weighted least square:

-99999.0


Ordinary least square:

-99999.0


Probabilities that GCOS criteria is met:

Weighted least square:

-99999.0 %

Ordinary least square:

-99999.0 %


DHR statistics

Temporal stability [1/decade]:


abs

rel


Weighted least square:

-99999.0


Ordinary least square:

-99999.0


Probabilities that GCOS criteria is met:

Weighted least square:

-99999.0 %

Ordinary least square:

-99999.0 %


Temporal anomaly analyis

The variance of the temporal anomalies provides an additional measure about the stability of the signal AFTER removal of the mean seasonal cylce.
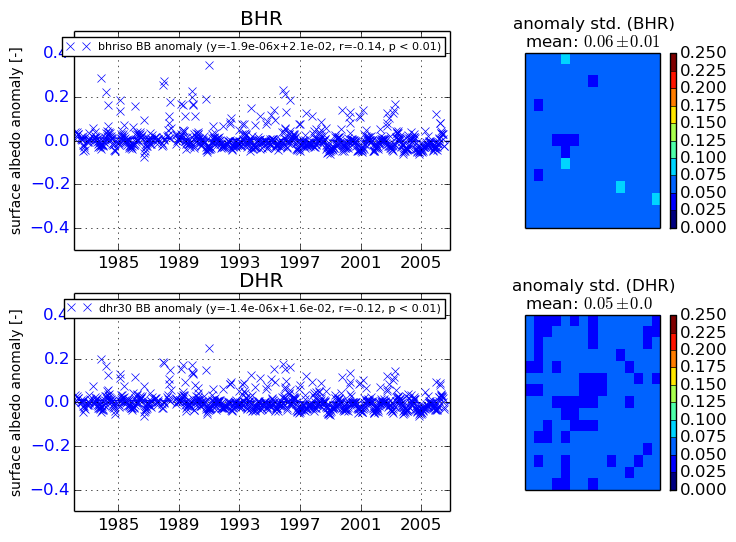
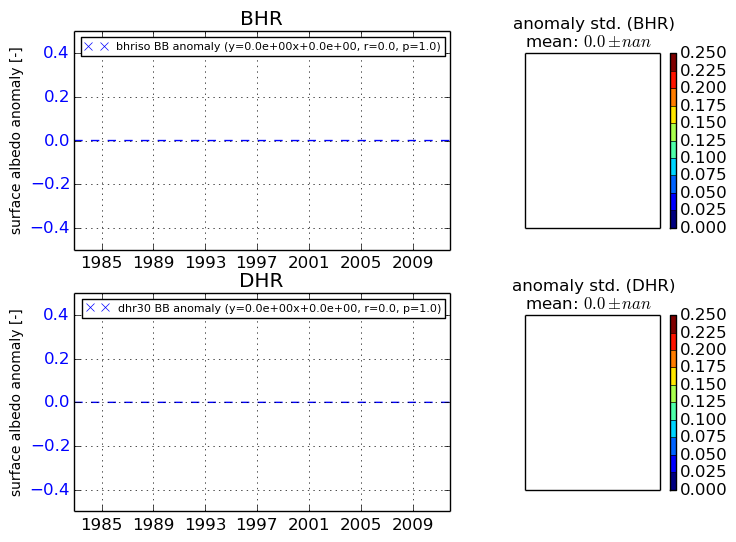
+000 deg


+057/+063 deg