RAILROAD_VALLEY


Location

lon / lat [deg]: -115.962 / 38.504

Source network: AERONET


Geostationary surface albedo (GSA) data


“+000”


“+057/+063”


Landcover information (based on ESA CCI landcover data)


Landcover fractions @ 2km distance


Landcover fractions @ 20 km distance


Legend


Distance to open water bodies [km]:

3.09

Distance to urban areas [km]:

6.35


Radius: 1 km

Number of landcover classes:

2

Dominant landcover type:

120: Shrubland

Fraction of dominant landcover type [%]:

72.0


Radius: 2 km

Number of landcover classes:

2

Dominant landcover type:

120: Shrubland

Fraction of dominant landcover type [%]:

86.0


Radius: 5 km

Number of landcover classes:

4

Dominant landcover type:

120: Shrubland

Fraction of dominant landcover type [%]:

94.0


Radius: 10 km

Number of landcover classes:

1

Dominant landcover type:

120: Shrubland

Fraction of dominant landcover type [%]:

98.0


Radius: 20 km

Number of landcover classes:

2

Dominant landcover type:

120: Shrubland

Fraction of dominant landcover type [%]:

96.0


Disturbances


Heterogeneity analysis

The heterogeneity analysis provides information about the spatial and temporal heterogeneity of the site.

Topography


Roman et al. (2009) index


St

5.99607817183

Rcv

0.291991383653

Rse

0.0

Rst

0.0371363186056

Rsv

-0.171199330517


Height range @ 1km [m]

92

Height range @ 2km [m]

139

Height range @ 5km [m]

222

Height range @ 10km [m]

-999

Height range @ 20km [m]

-999


Variance slope @ 1 km

964

Variance slope @ 2 km

1085

Variance slope @ 5 km

1195

Variance slope @ 10 km

-999

Variance slope @ 20 km

-999


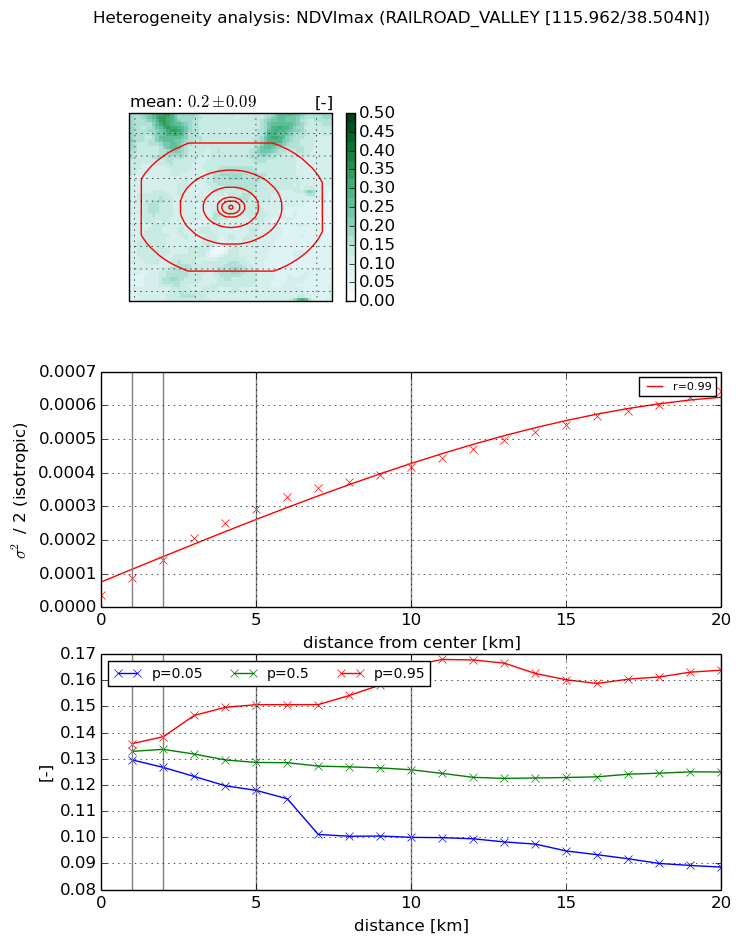
NDVI (max. NDVI composite)


Roman et al. (2009) index


St

5.29233763761

Rcv

0.421657215216

Rse

0.0

Rst

0.0131946691187

Rsv

0.132005373351


NDVI range @ 1km [-]

0.01

NDVI range @ 2km [-]

0.01

NDVI range @ 5km [-]

0.03

NDVI range @ 10km [-]

0.07

NDVI range @ 20km [-]

0.08


Variance slope @ 1 km

4.93126746229e-05

Variance slope @ 2 km

5.16712838124e-05

Variance slope @ 5 km

5.2406793846e-05

Variance slope @ 10 km

3.81788293913e-05

Variance slope @ 20 km

2.83594382341e-05


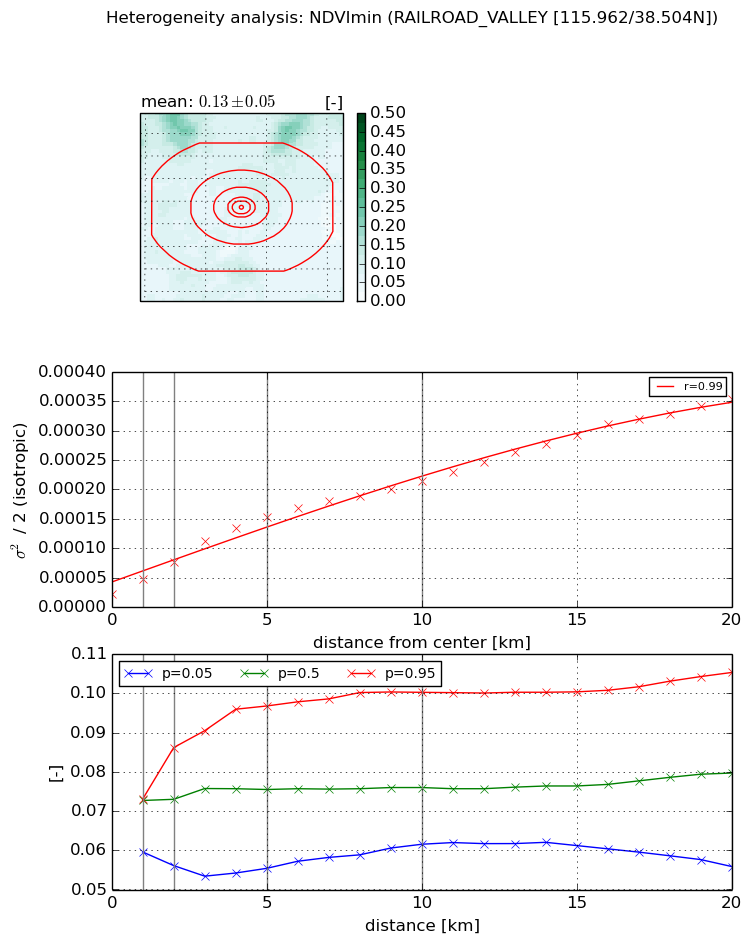
NDVI (min. NDVI composite)I


Roman et al. (2009) index


St

9.48752115328

Rcv

-0.0578349117062

Rse

0.0

Rst

-0.0158057261692

Rsv

0.242564190713


NDVI range @ 1km [-]

0.01

NDVI range @ 2km [-]

0.03

NDVI range @ 5km [-]

0.04

NDVI range @ 10km [-]

0.04

NDVI range @ 20km [-]

0.05


NDVI slope @ 1 km

2.62768063779e-05

NDVI slope @ 2 km

2.75914045484e-05

NDVI slope @ 5 km

2.73752954471e-05

NDVI slope @ 10 km

1.88732459906e-05

NDVI slope @ 20 km

1.5587539818e-05


Temporal stability analysis

+000 deg (BHR)


BHR statistics

Temporal stability [1/decade]:


abs

rel


Weighted least square:

None


Ordinary least square:

None


Probabilities that GCOS criteria is met:

Weighted least square:

None %

Ordinary least square:

None %


DHR statistics

Temporal stability [1/decade]:


abs

rel


Weighted least square:

None


Ordinary least square:

None


Probabilities that GCOS criteria is met:

Weighted least square:

None %

Ordinary least square:

None %


+057/+063 deg (BHR)


BHR statistics

Temporal stability [1/decade]:


abs

rel


Weighted least square:

None


Ordinary least square:

None


Probabilities that GCOS criteria is met:

Weighted least square:

None %

Ordinary least square:

None %


DHR statistics

Temporal stability [1/decade]:


abs

rel


Weighted least square:

None


Ordinary least square:

None


Probabilities that GCOS criteria is met:

Weighted least square:

None %

Ordinary least square:

None %


Temporal anomaly analyis

The variance of the temporal anomalies provides an additional measure about the stability of the signal AFTER removal of the mean seasonal cylce.

+000 deg


+057/+063 deg