RED_RIVER_DELTA


Location

lon / lat [deg]: 106.1277 / 20.7285

Source network: AERONET


Geostationary surface albedo (GSA) data


“+000”


“+057/+063”


Landcover information (based on ESA CCI landcover data)


Landcover fractions @ 2km distance


Landcover fractions @ 20 km distance


Legend


Distance to open water bodies [km]:

7.78

Distance to urban areas [km]:

1.55


Radius: 1 km

Number of landcover classes:

2

Dominant landcover type:

10: cropland, rainfed

Fraction of dominant landcover type [%]:

67.0


Radius: 2 km

Number of landcover classes:

3

Dominant landcover type:

10: cropland, rainfed

Fraction of dominant landcover type [%]:

82.0


Radius: 5 km

Number of landcover classes:

4

Dominant landcover type:

10: cropland, rainfed

Fraction of dominant landcover type [%]:

61.0


Radius: 10 km

Number of landcover classes:

4

Dominant landcover type:

10: cropland, rainfed

Fraction of dominant landcover type [%]:

57.0


Radius: 20 km

Number of landcover classes:

6

Dominant landcover type:

10: cropland, rainfed

Fraction of dominant landcover type [%]:

49.0


Disturbances


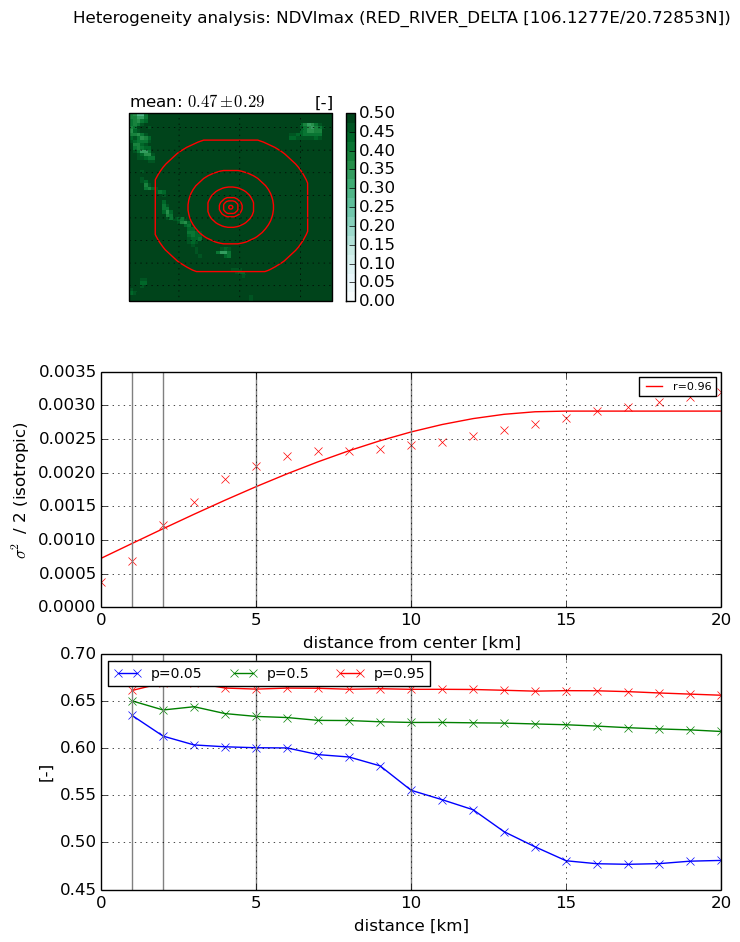
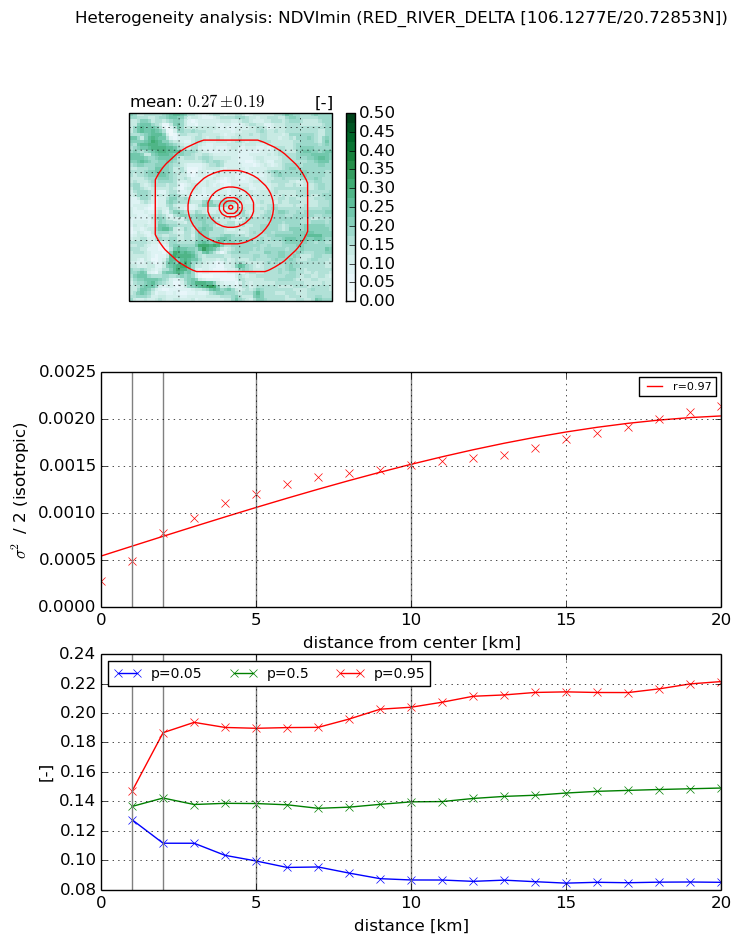
Heterogeneity analysis

The heterogeneity analysis provides information about the spatial and temporal heterogeneity of the site.

Topography


Roman et al. (2009) index


St

21.1851915994

Rcv

0.06668516006

Rse

0.0

Rst

-0.053971152318

Rsv

0.020952036356


Height range @ 1km [m]

3

Height range @ 2km [m]

4

Height range @ 5km [m]

4

Height range @ 10km [m]

-999

Height range @ 20km [m]

-999


Variance slope @ 1 km

0

Variance slope @ 2 km

0

Variance slope @ 5 km

0

Variance slope @ 10 km

-999

Variance slope @ 20 km

-999


NDVI (max. NDVI composite)


Roman et al. (2009) index


St

15.3064132428

Rcv

-0.0746718890626

Rse

0.0

Rst

-0.0881017319786

Rsv

-0.0332226553179


NDVI range @ 1km [-]

0.03

NDVI range @ 2km [-]

0.06

NDVI range @ 5km [-]

0.06

NDVI range @ 10km [-]

0.11

NDVI range @ 20km [-]

0.18


Variance slope @ 1 km

0.000304547662636

Variance slope @ 2 km

0.00042088285412

Variance slope @ 5 km

0.000360920908111

Variance slope @ 10 km

0.000200671818965

Variance slope @ 20 km

0.000114046680078


NDVI (min. NDVI composite)I


Roman et al. (2009) index


St

7.75627180479

Rcv

0.00829809057564

Rse

0.0

Rst

0.109074668302

Rsv

-0.269411004702


NDVI range @ 1km [-]

0.02

NDVI range @ 2km [-]

0.08

NDVI range @ 5km [-]

0.09

NDVI range @ 10km [-]

0.12

NDVI range @ 20km [-]

0.14


NDVI slope @ 1 km

0.00020597616498

NDVI slope @ 2 km

0.00025138826649

NDVI slope @ 5 km

0.000189450412752

NDVI slope @ 10 km

0.000118612097482

NDVI slope @ 20 km

7.70525120774e-05


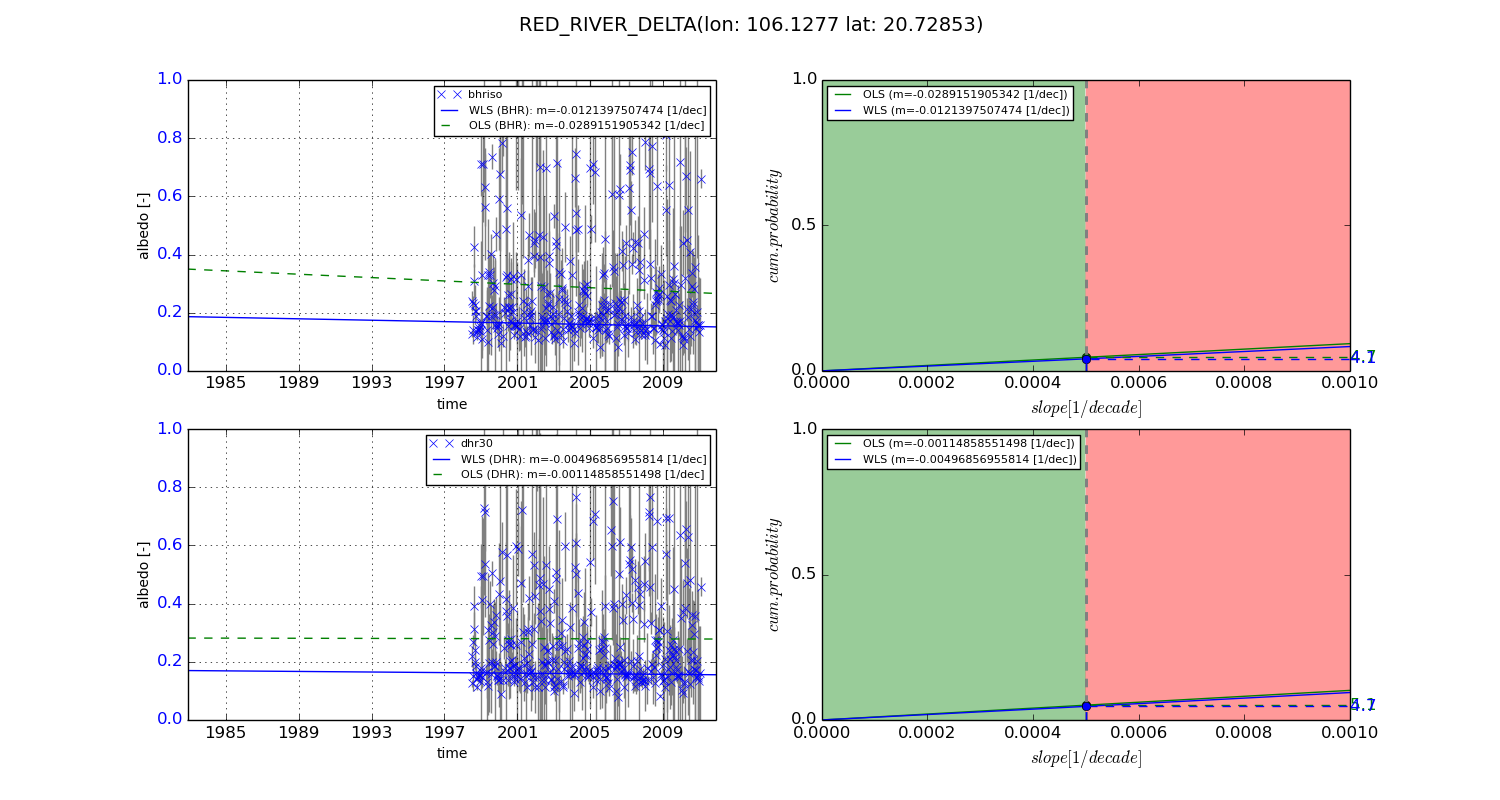
Temporal stability analysis

+000 deg (BHR)


BHR statistics

Temporal stability [1/decade]:


abs

rel


Weighted least square:

None


Ordinary least square:

None


Probabilities that GCOS criteria is met:

Weighted least square:

None %

Ordinary least square:

None %


DHR statistics

Temporal stability [1/decade]:


abs

rel


Weighted least square:

None


Ordinary least square:

None


Probabilities that GCOS criteria is met:

Weighted least square:

None %

Ordinary least square:

None %


+057/+063 deg (BHR)


BHR statistics

Temporal stability [1/decade]:


abs

rel


Weighted least square:

-0.0121397507474


Ordinary least square:

-0.0289151905342


Probabilities that GCOS criteria is met:

Weighted least square:

4.1 %

Ordinary least square:

4.7 %


DHR statistics

Temporal stability [1/decade]:


abs

rel


Weighted least square:

-0.00496856955814


Ordinary least square:

-0.00114858551498


Probabilities that GCOS criteria is met:

Weighted least square:

4.7 %

Ordinary least square:

5.1 %


Temporal anomaly analyis

The variance of the temporal anomalies provides an additional measure about the stability of the signal AFTER removal of the mean seasonal cylce.

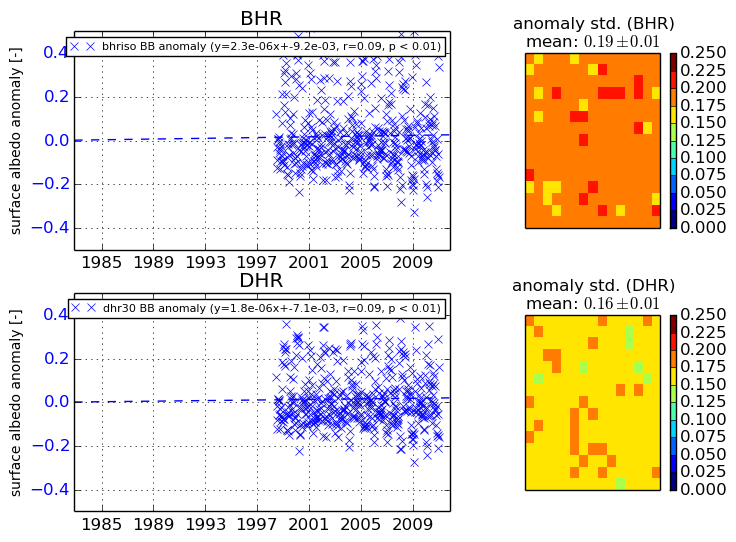
+000 deg


+057/+063 deg