RIMROCK


Location

lon / lat [deg]: -116.9917 / 46.4875

Source network: AERONET


Geostationary surface albedo (GSA) data


“+000”


“+057/+063”


Landcover information (based on ESA CCI landcover data)


Landcover fractions @ 2km distance


Landcover fractions @ 20 km distance


Legend


Distance to open water bodies [km]:

6.27

Distance to urban areas [km]:

3.49


Radius: 1 km

Number of landcover classes:

2

Dominant landcover type:

10: cropland, rainfed

Fraction of dominant landcover type [%]:

96.0


Radius: 2 km

Number of landcover classes:

2

Dominant landcover type:

10: cropland, rainfed

Fraction of dominant landcover type [%]:

72.0


Radius: 5 km

Number of landcover classes:

3

Dominant landcover type:

10: cropland, rainfed

Fraction of dominant landcover type [%]:

64.0


Radius: 10 km

Number of landcover classes:

5

Dominant landcover type:

10: cropland, rainfed

Fraction of dominant landcover type [%]:

61.0


Radius: 20 km

Number of landcover classes:

5

Dominant landcover type:

10: cropland, rainfed

Fraction of dominant landcover type [%]:

56.0


Disturbances


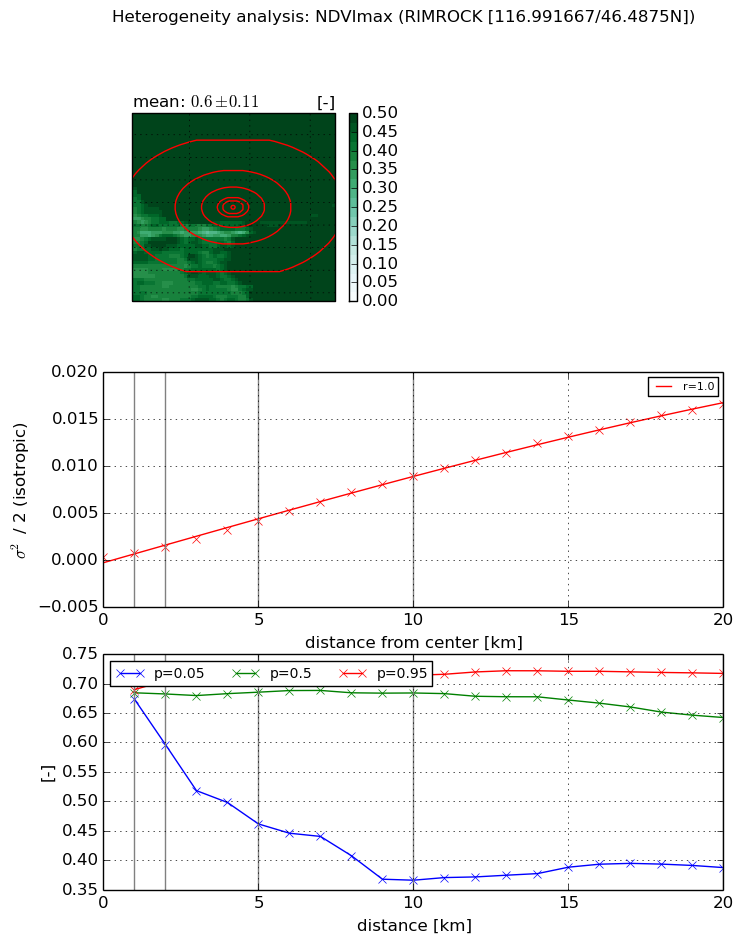
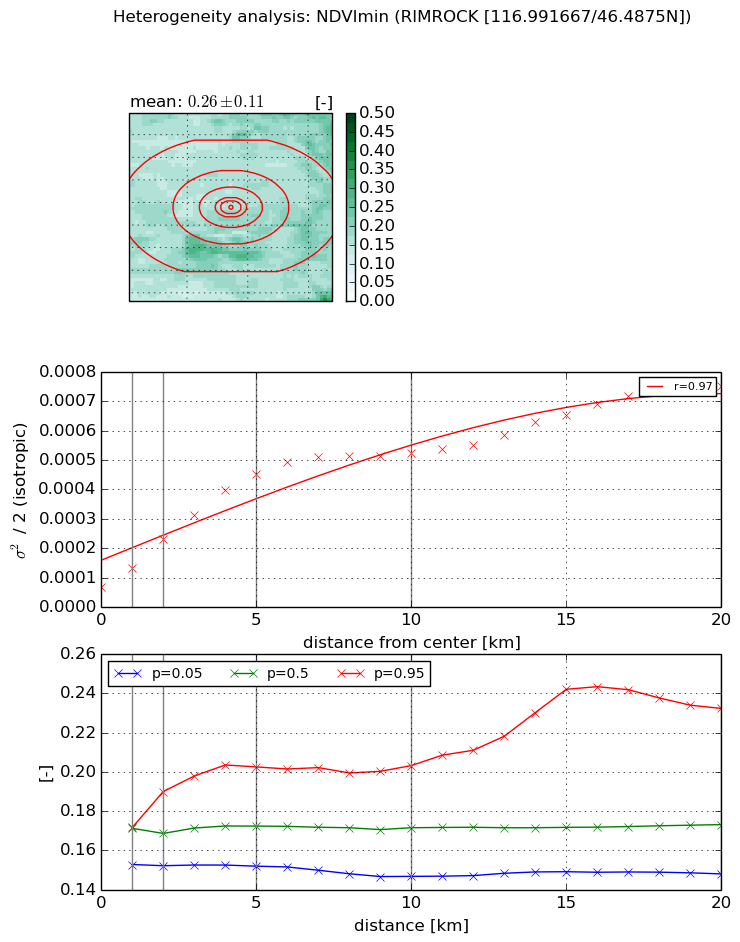
Heterogeneity analysis

The heterogeneity analysis provides information about the spatial and temporal heterogeneity of the site.

Topography


Roman et al. (2009) index


St

2.04402001269

Rcv

0.385493127172

Rse

0.0

Rst

-0.0822069908326

Rsv

-0.999995883686


Height range @ 1km [m]

72

Height range @ 2km [m]

282

Height range @ 5km [m]

426

Height range @ 10km [m]

-999

Height range @ 20km [m]

-999


Variance slope @ 1 km

3260

Variance slope @ 2 km

3578

Variance slope @ 5 km

4873

Variance slope @ 10 km

-999

Variance slope @ 20 km

-999


NDVI (max. NDVI composite)


Roman et al. (2009) index


St

1.01012892651e-07

Rcv

0.447698974098

Rse

0.0

Rst

0.106383701168

Rsv

29699178.6425


NDVI range @ 1km [-]

0.02

NDVI range @ 2km [-]

0.11

NDVI range @ 5km [-]

0.25

NDVI range @ 10km [-]

0.35

NDVI range @ 20km [-]

0.33


Variance slope @ 1 km

0.000392468701154

Variance slope @ 2 km

0.000541035053022

Variance slope @ 5 km

0.000772099907772

Variance slope @ 10 km

0.000908170134092

Variance slope @ 20 km

0.000858027194576


NDVI (min. NDVI composite)I


Roman et al. (2009) index


St

8.65050909387

Rcv

0.0541538150577

Rse

0.0

Rst

-0.201950042551

Rsv

-0.0906965407776


NDVI range @ 1km [-]

0.02

NDVI range @ 2km [-]

0.04

NDVI range @ 5km [-]

0.05

NDVI range @ 10km [-]

0.06

NDVI range @ 20km [-]

0.08


NDVI slope @ 1 km

6.45826506729e-05

NDVI slope @ 2 km

8.1194913847e-05

NDVI slope @ 5 km

7.9843393194e-05

NDVI slope @ 10 km

4.67709297705e-05

NDVI slope @ 20 km

2.95568637822e-05


Temporal stability analysis

+000 deg (BHR)


BHR statistics

Temporal stability [1/decade]:


abs

rel


Weighted least square:

None


Ordinary least square:

None


Probabilities that GCOS criteria is met:

Weighted least square:

None %

Ordinary least square:

None %


DHR statistics

Temporal stability [1/decade]:


abs

rel


Weighted least square:

None


Ordinary least square:

None


Probabilities that GCOS criteria is met:

Weighted least square:

None %

Ordinary least square:

None %


+057/+063 deg (BHR)


BHR statistics

Temporal stability [1/decade]:


abs

rel


Weighted least square:

None


Ordinary least square:

None


Probabilities that GCOS criteria is met:

Weighted least square:

None %

Ordinary least square:

None %


DHR statistics

Temporal stability [1/decade]:


abs

rel


Weighted least square:

None


Ordinary least square:

None


Probabilities that GCOS criteria is met:

Weighted least square:

None %

Ordinary least square:

None %


Temporal anomaly analyis

The variance of the temporal anomalies provides an additional measure about the stability of the signal AFTER removal of the mean seasonal cylce.

+000 deg


+057/+063 deg