ROSSFELD


Location

lon / lat [deg]: 7.6248 / 48.3351

Source network: AERONET


Geostationary surface albedo (GSA) data


“+000”


“+057/+063”


Landcover information (based on ESA CCI landcover data)


Landcover fractions @ 2km distance


Landcover fractions @ 20 km distance


Legend


Distance to open water bodies [km]:

5.01

Distance to urban areas [km]:

0.39


Radius: 1 km

Number of landcover classes:

4

Dominant landcover type:

10: cropland, rainfed

Fraction of dominant landcover type [%]:

63.0


Radius: 2 km

Number of landcover classes:

6

Dominant landcover type:

10: cropland, rainfed

Fraction of dominant landcover type [%]:

66.0


Radius: 5 km

Number of landcover classes:

5

Dominant landcover type:

10: cropland, rainfed

Fraction of dominant landcover type [%]:

58.0


Radius: 10 km

Number of landcover classes:

7

Dominant landcover type:

10: cropland, rainfed

Fraction of dominant landcover type [%]:

56.0


Radius: 20 km

Number of landcover classes:

9

Dominant landcover type:

10: cropland, rainfed

Fraction of dominant landcover type [%]:

51.0


Disturbances


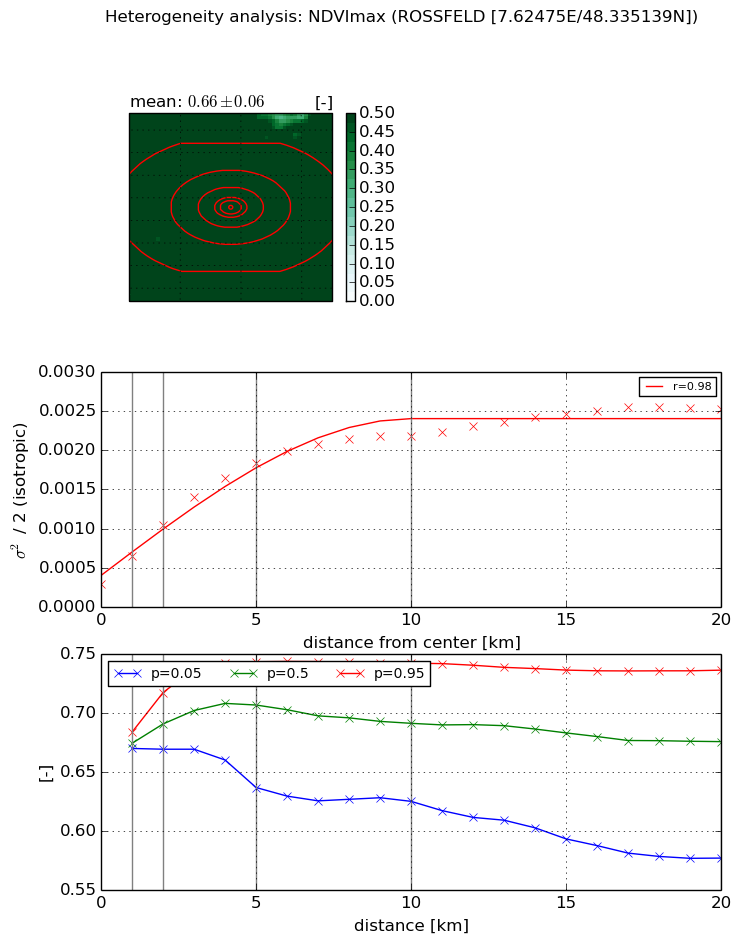
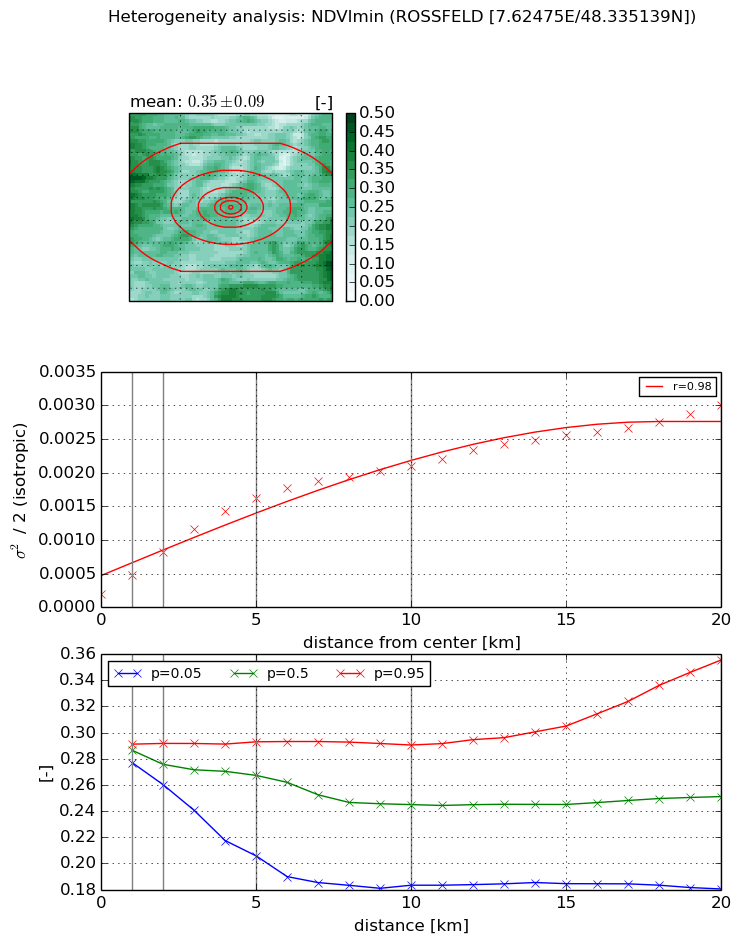
Heterogeneity analysis

The heterogeneity analysis provides information about the spatial and temporal heterogeneity of the site.

Topography


Roman et al. (2009) index


St

11.6207751256

Rcv

0.204572781823

Rse

0.0

Rst

-1.07905865893e-08

Rsv

-0.0535855460156


Height range @ 1km [m]

7

Height range @ 2km [m]

8

Height range @ 5km [m]

11

Height range @ 10km [m]

-999

Height range @ 20km [m]

-999


Variance slope @ 1 km

4

Variance slope @ 2 km

2

Variance slope @ 5 km

1

Variance slope @ 10 km

-999

Variance slope @ 20 km

-999


NDVI (max. NDVI composite)


Roman et al. (2009) index


St

nan

Rcv

nan

Rse

nan

Rst

nan

Rsv

nan


NDVI range @ 1km [-]

0.01

NDVI range @ 2km [-]

0.05

NDVI range @ 5km [-]

0.11

NDVI range @ 10km [-]

0.12

NDVI range @ 20km [-]

0.16


Variance slope @ 1 km

0.000356738892866

Variance slope @ 2 km

0.000379406166286

Variance slope @ 5 km

0.000316695059486

Variance slope @ 10 km

0.000187250556226

Variance slope @ 20 km

9.17418578793e-05


NDVI (min. NDVI composite)I


Roman et al. (2009) index


St

3.08958006239

Rcv

0.531336415928

Rse

0.0

Rst

-0.265534765439

Rsv

-0.174134566801


NDVI range @ 1km [-]

0.01

NDVI range @ 2km [-]

0.03

NDVI range @ 5km [-]

0.09

NDVI range @ 10km [-]

0.11

NDVI range @ 20km [-]

0.18


NDVI slope @ 1 km

0.000288941592228

NDVI slope @ 2 km

0.000316937845217

NDVI slope @ 5 km

0.000296088009589

NDVI slope @ 10 km

0.000190188336623

NDVI slope @ 20 km

0.000120578597392


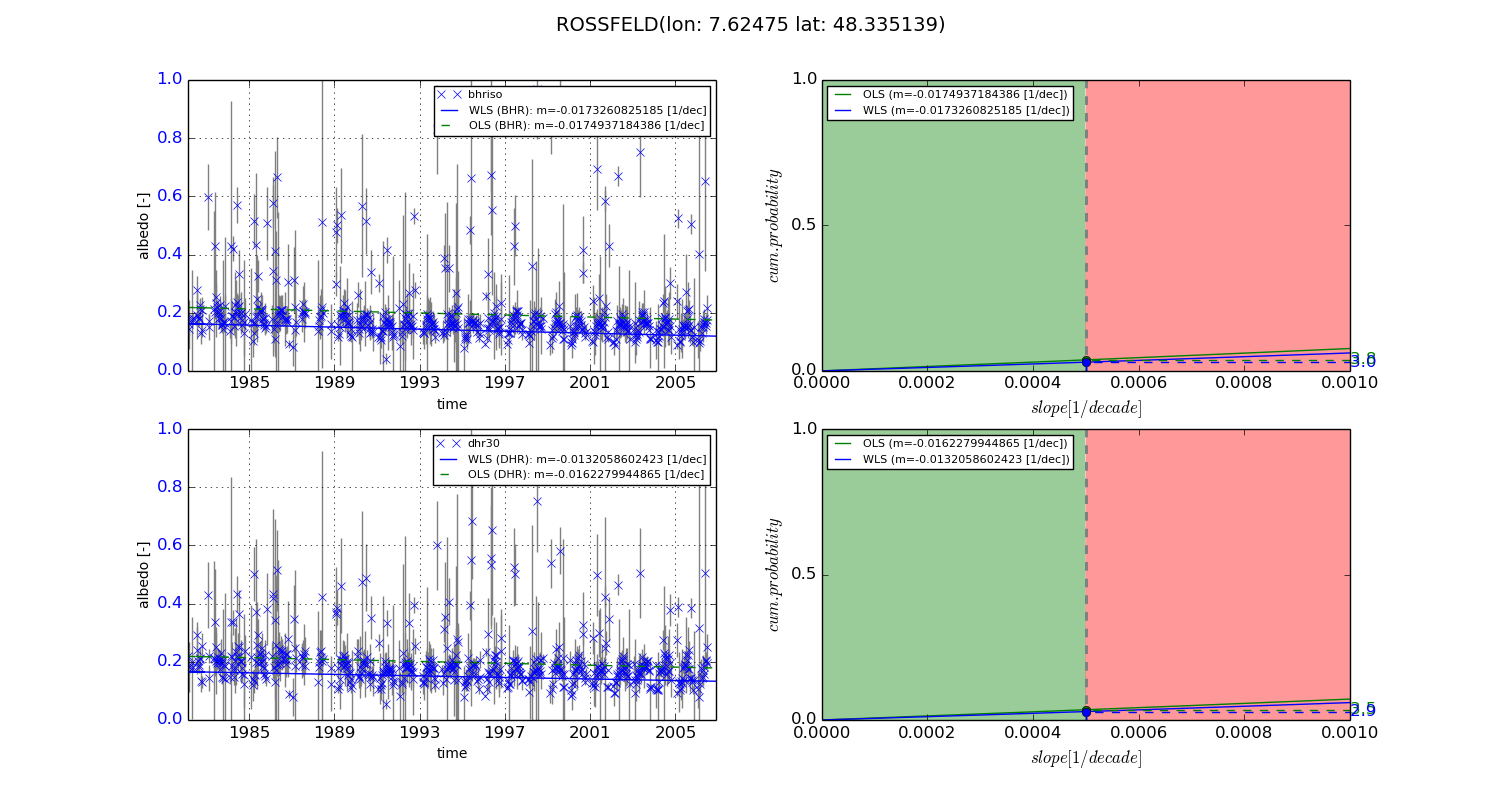
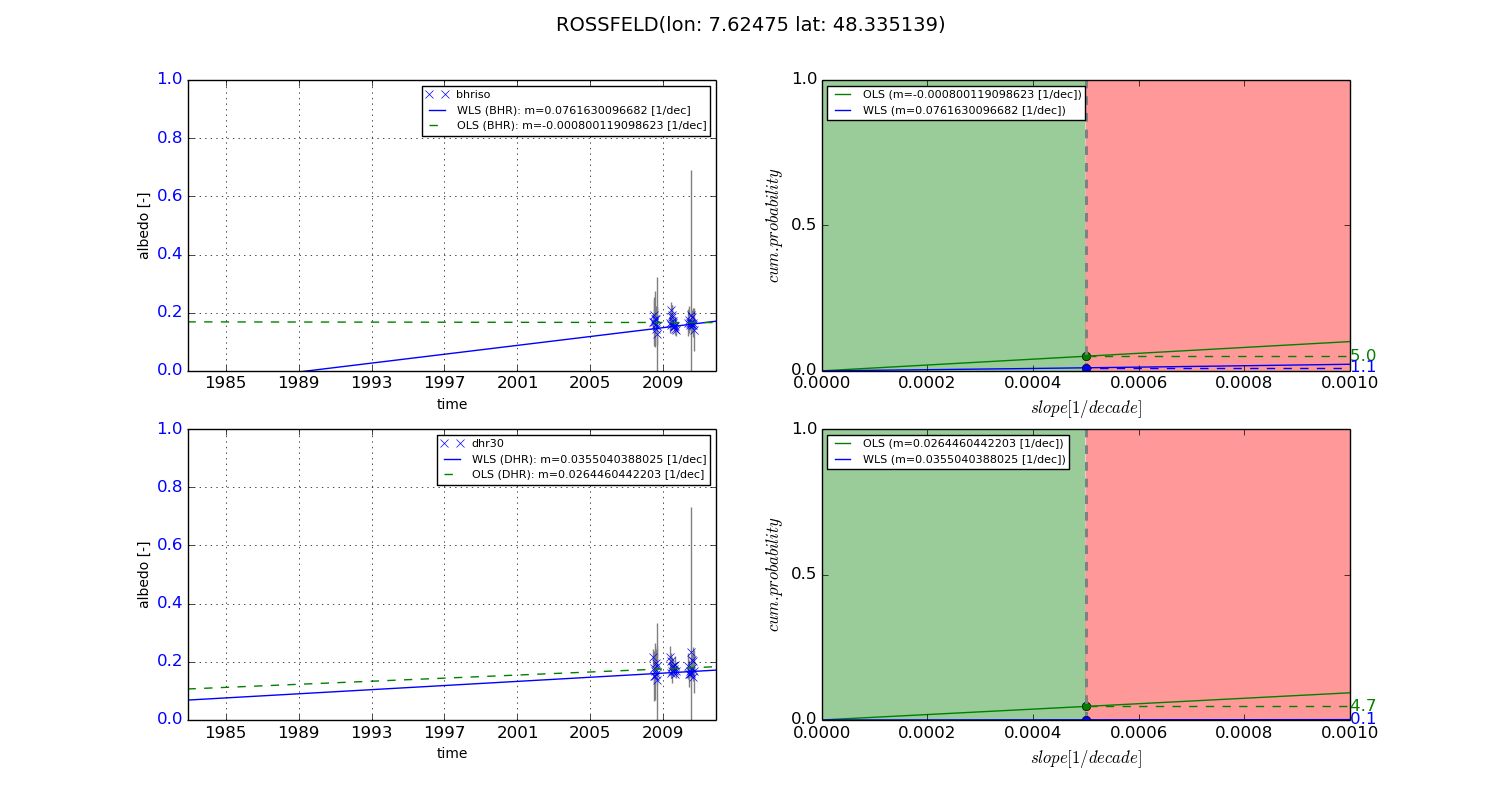
Temporal stability analysis

+000 deg (BHR)


BHR statistics

Temporal stability [1/decade]:


abs

rel


Weighted least square:

-0.0173260825185


Ordinary least square:

-0.0174937184386


Probabilities that GCOS criteria is met:

Weighted least square:

3.0 %

Ordinary least square:

3.8 %


DHR statistics

Temporal stability [1/decade]:


abs

rel


Weighted least square:

-0.0132058602423


Ordinary least square:

-0.0162279944865


Probabilities that GCOS criteria is met:

Weighted least square:

2.9 %

Ordinary least square:

3.5 %


+057/+063 deg (BHR)


BHR statistics

Temporal stability [1/decade]:


abs

rel


Weighted least square:

0.0761630096682


Ordinary least square:

-0.000800119098623


Probabilities that GCOS criteria is met:

Weighted least square:

1.1 %

Ordinary least square:

5.0 %


DHR statistics

Temporal stability [1/decade]:


abs

rel


Weighted least square:

0.0355040388025


Ordinary least square:

0.0264460442203


Probabilities that GCOS criteria is met:

Weighted least square:

0.1 %

Ordinary least square:

4.7 %


Temporal anomaly analyis

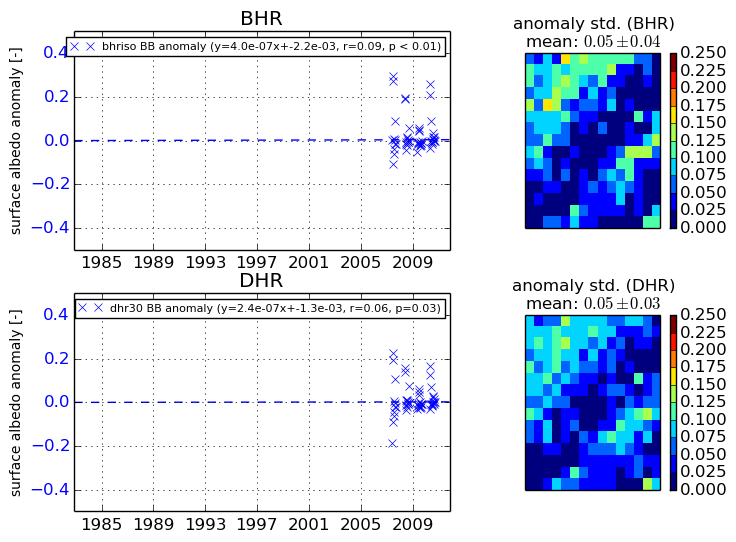
The variance of the temporal anomalies provides an additional measure about the stability of the signal AFTER removal of the mean seasonal cylce.
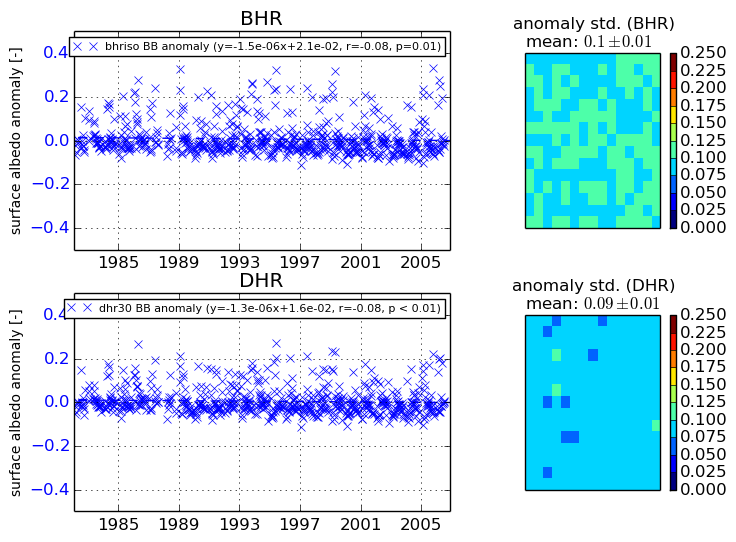
+000 deg


+057/+063 deg