RU-ZOT


Location

lon / lat [deg]: 89.3508 / 60.8008

Source network: FLUXNET


Geostationary surface albedo (GSA) data


“+000”


“+057/+063”


Landcover information (based on ESA CCI landcover data)


Landcover fractions @ 2km distance


Landcover fractions @ 20 km distance


Legend


Distance to open water bodies [km]:

8.18

Distance to urban areas [km]:

none in region


Radius: 1 km

Number of landcover classes:

5

Dominant landcover type:

70: Tree cover, needleleaved, evergreen, closed to open (>15%)

Fraction of dominant landcover type [%]:

60.0


Radius: 2 km

Number of landcover classes:

6

Dominant landcover type:

70: Tree cover, needleleaved, evergreen, closed to open (>15%)

Fraction of dominant landcover type [%]:

70.0


Radius: 5 km

Number of landcover classes:

5

Dominant landcover type:

70: Tree cover, needleleaved, evergreen, closed to open (>15%)

Fraction of dominant landcover type [%]:

48.0


Radius: 10 km

Number of landcover classes:

5

Dominant landcover type:

70: Tree cover, needleleaved, evergreen, closed to open (>15%)

Fraction of dominant landcover type [%]:

47.0


Radius: 20 km

Number of landcover classes:

6

Dominant landcover type:

70: Tree cover, needleleaved, evergreen, closed to open (>15%)

Fraction of dominant landcover type [%]:

55.0


Disturbances


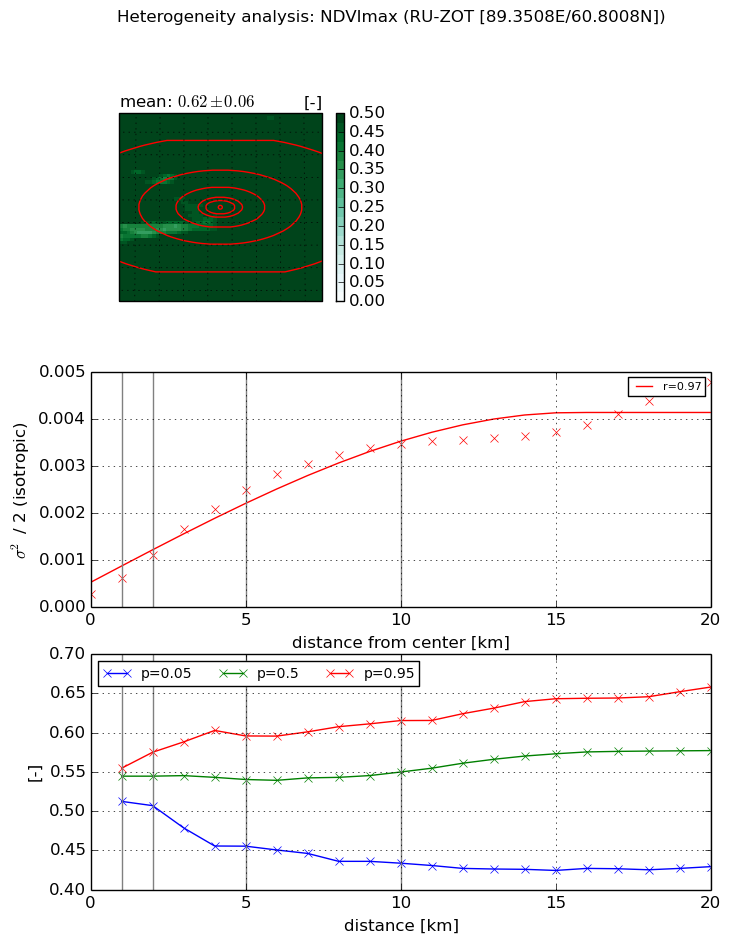
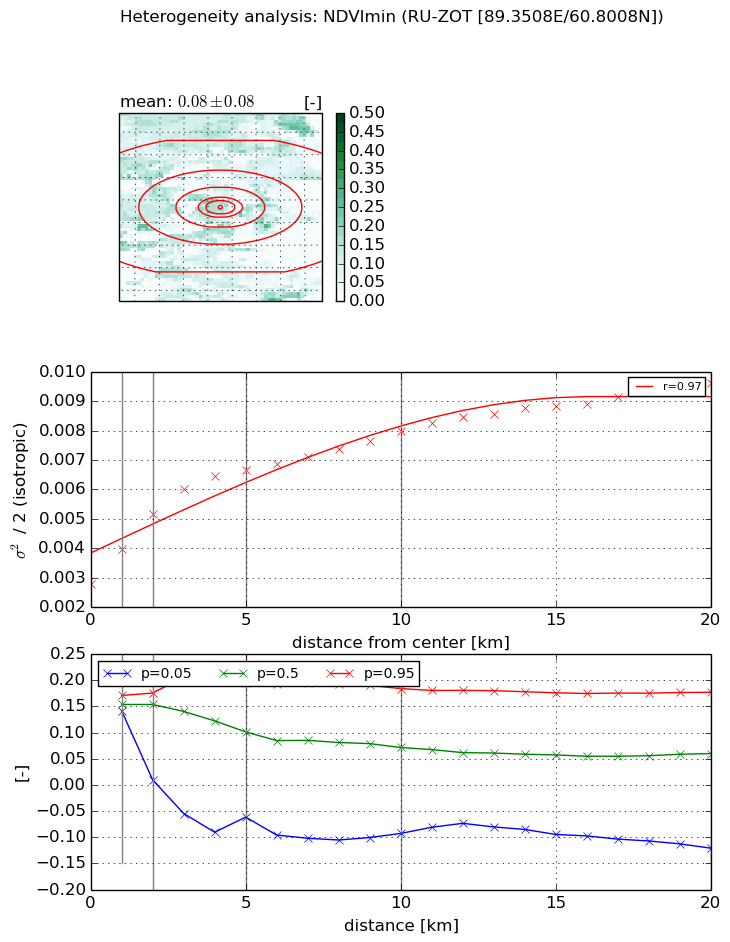
Heterogeneity analysis

The heterogeneity analysis provides information about the spatial and temporal heterogeneity of the site.

Topography


Roman et al. (2009) index


St

2.66830086576

Rcv

0.101211389528

Rse

0.0

Rst

-0.0232069682928

Rsv

-0.999892636677


Height range @ 1km [m]

39

Height range @ 2km [m]

75

Height range @ 5km [m]

77

Height range @ 10km [m]

-999

Height range @ 20km [m]

-999


Variance slope @ 1 km

101

Variance slope @ 2 km

125

Variance slope @ 5 km

141

Variance slope @ 10 km

-999

Variance slope @ 20 km

-999


NDVI (max. NDVI composite)


Roman et al. (2009) index


St

2.88670893934

Rcv

0.270556123184

Rse

0.0

Rst

-0.248305031381

Rsv

0.520384596579


NDVI range @ 1km [-]

0.04

NDVI range @ 2km [-]

0.07

NDVI range @ 5km [-]

0.14

NDVI range @ 10km [-]

0.18

NDVI range @ 20km [-]

0.23


Variance slope @ 1 km

0.000341558462268

Variance slope @ 2 km

0.000422511317459

Variance slope @ 5 km

0.000458088582839

Variance slope @ 10 km

0.000334678559868

Variance slope @ 20 km

0.000190638866024


NDVI (min. NDVI composite)I


Roman et al. (2009) index


St

3.7585971729

Rcv

0.272503010394

Rse

0.0

Rst

0.0835447247034

Rsv

-0.44212239647


NDVI range @ 1km [-]

0.03

NDVI range @ 2km [-]

0.17

NDVI range @ 5km [-]

0.26

NDVI range @ 10km [-]

0.28

NDVI range @ 20km [-]

0.3


NDVI slope @ 1 km

0.00121861637179

NDVI slope @ 2 km

0.00119871338584

NDVI slope @ 5 km

0.000792194604416

NDVI slope @ 10 km

0.000453399572377

NDVI slope @ 20 km

0.000277794316542


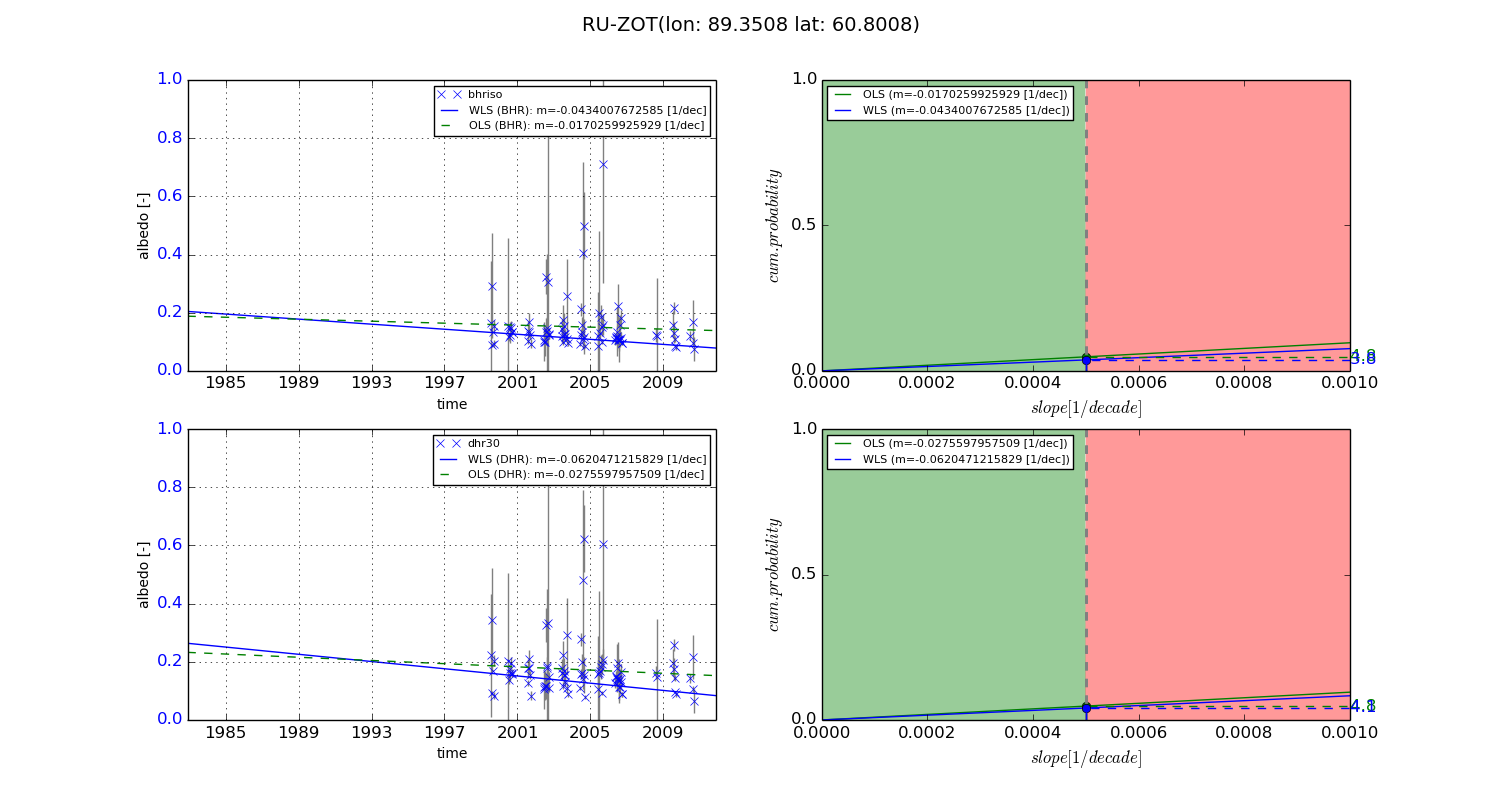
Temporal stability analysis

+000 deg (BHR)


BHR statistics

Temporal stability [1/decade]:


abs

rel


Weighted least square:

None


Ordinary least square:

None


Probabilities that GCOS criteria is met:

Weighted least square:

None %

Ordinary least square:

None %


DHR statistics

Temporal stability [1/decade]:


abs

rel


Weighted least square:

None


Ordinary least square:

None


Probabilities that GCOS criteria is met:

Weighted least square:

None %

Ordinary least square:

None %


+057/+063 deg (BHR)


BHR statistics

Temporal stability [1/decade]:


abs

rel


Weighted least square:

-0.0434007672585


Ordinary least square:

-0.0170259925929


Probabilities that GCOS criteria is met:

Weighted least square:

3.8 %

Ordinary least square:

4.8 %


DHR statistics

Temporal stability [1/decade]:


abs

rel


Weighted least square:

-0.0620471215829


Ordinary least square:

-0.0275597957509


Probabilities that GCOS criteria is met:

Weighted least square:

4.1 %

Ordinary least square:

4.8 %


Temporal anomaly analyis

The variance of the temporal anomalies provides an additional measure about the stability of the signal AFTER removal of the mean seasonal cylce.

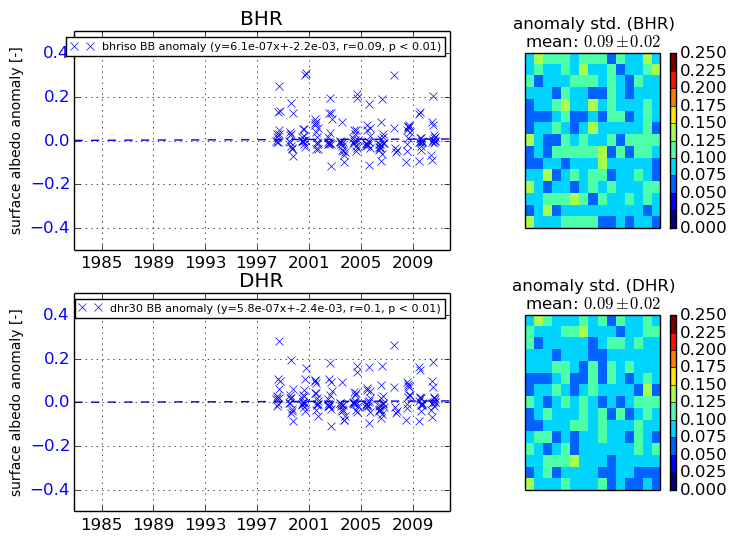
+000 deg


+057/+063 deg