SALTLAKE_NAMAK


Location

lon / lat [deg]: 51.853 / 34.519

Source network: ALBEDOVAL2


Geostationary surface albedo (GSA) data


“+000”


“+057/+063”


Landcover information (based on ESA CCI landcover data)


Landcover fractions @ 2km distance


Landcover fractions @ 20 km distance


Legend


Distance to open water bodies [km]:

0.15

Distance to urban areas [km]:

59.01


Radius: 1 km

Number of landcover classes:

1

Dominant landcover type:

210: water bodies

Fraction of dominant landcover type [%]:

100.0


Radius: 2 km

Number of landcover classes:

1

Dominant landcover type:

210: water bodies

Fraction of dominant landcover type [%]:

100.0


Radius: 5 km

Number of landcover classes:

1

Dominant landcover type:

210: water bodies

Fraction of dominant landcover type [%]:

100.0


Radius: 10 km

Number of landcover classes:

1

Dominant landcover type:

210: water bodies

Fraction of dominant landcover type [%]:

100.0


Radius: 20 km

Number of landcover classes:

2

Dominant landcover type:

210: water bodies

Fraction of dominant landcover type [%]:

94.0


Disturbances


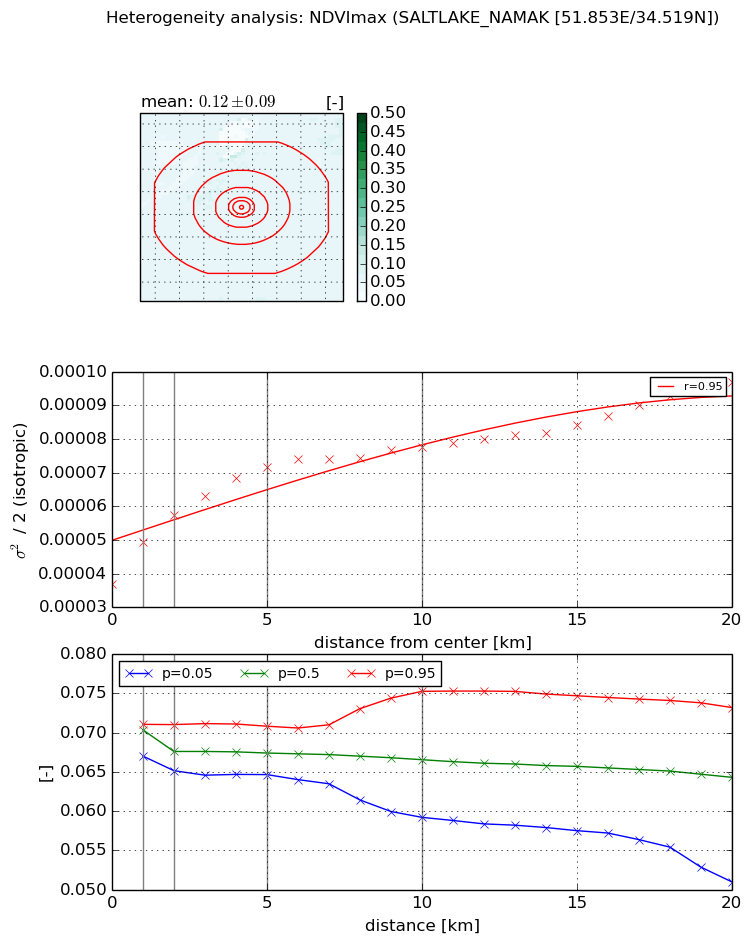
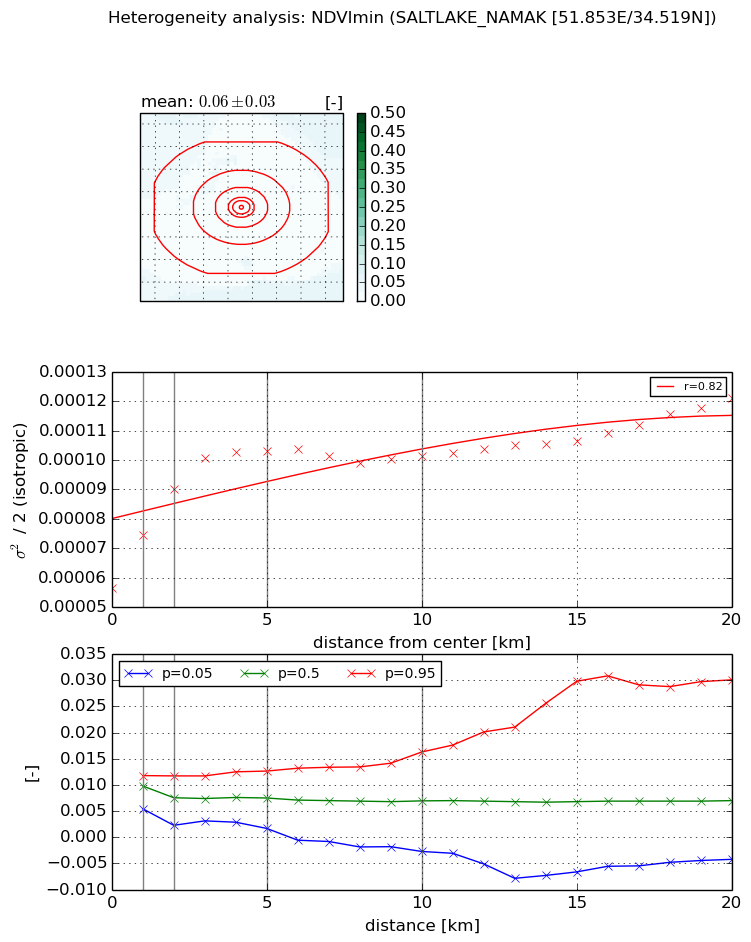
Heterogeneity analysis

The heterogeneity analysis provides information about the spatial and temporal heterogeneity of the site.

Topography


Roman et al. (2009) index


St

0.137266948299

Rcv

0.0185557894725

Rse

0.0

Rst

-0.89240300137

Rsv

20.9442659168


Height range @ 1km [m]

3

Height range @ 2km [m]

4

Height range @ 5km [m]

4

Height range @ 10km [m]

-999

Height range @ 20km [m]

-999


Variance slope @ 1 km

0

Variance slope @ 2 km

0

Variance slope @ 5 km

0

Variance slope @ 10 km

-999

Variance slope @ 20 km

-999


NDVI (max. NDVI composite)


Roman et al. (2009) index


St

6.32129198913e-06

Rcv

-0.155162291935

Rse

0.0

Rst

0.537381305719

Rsv

474585.832673


NDVI range @ 1km [-]

0.0

NDVI range @ 2km [-]

0.01

NDVI range @ 5km [-]

0.01

NDVI range @ 10km [-]

0.02

NDVI range @ 20km [-]

0.02


Variance slope @ 1 km

1.26608235093e-05

Variance slope @ 2 km

1.02653684583e-05

Variance slope @ 5 km

6.74792269697e-06

Variance slope @ 10 km

3.56603359949e-06

Variance slope @ 20 km

2.22709531002e-06


NDVI (min. NDVI composite)I


Roman et al. (2009) index


St

1.93771047047

Rcv

0.459778876039

Rse

0.0

Rst

-0.934010571175

Rsv

-0.154429466667


NDVI range @ 1km [-]

0.01

NDVI range @ 2km [-]

0.01

NDVI range @ 5km [-]

0.01

NDVI range @ 10km [-]

0.02

NDVI range @ 20km [-]

0.03


NDVI slope @ 1 km

1.83109458967e-05

NDVI slope @ 2 km

1.69026882186e-05

NDVI slope @ 5 km

9.37044188871e-06

NDVI slope @ 10 km

3.24149186439e-06

NDVI slope @ 20 km

1.82430989204e-06


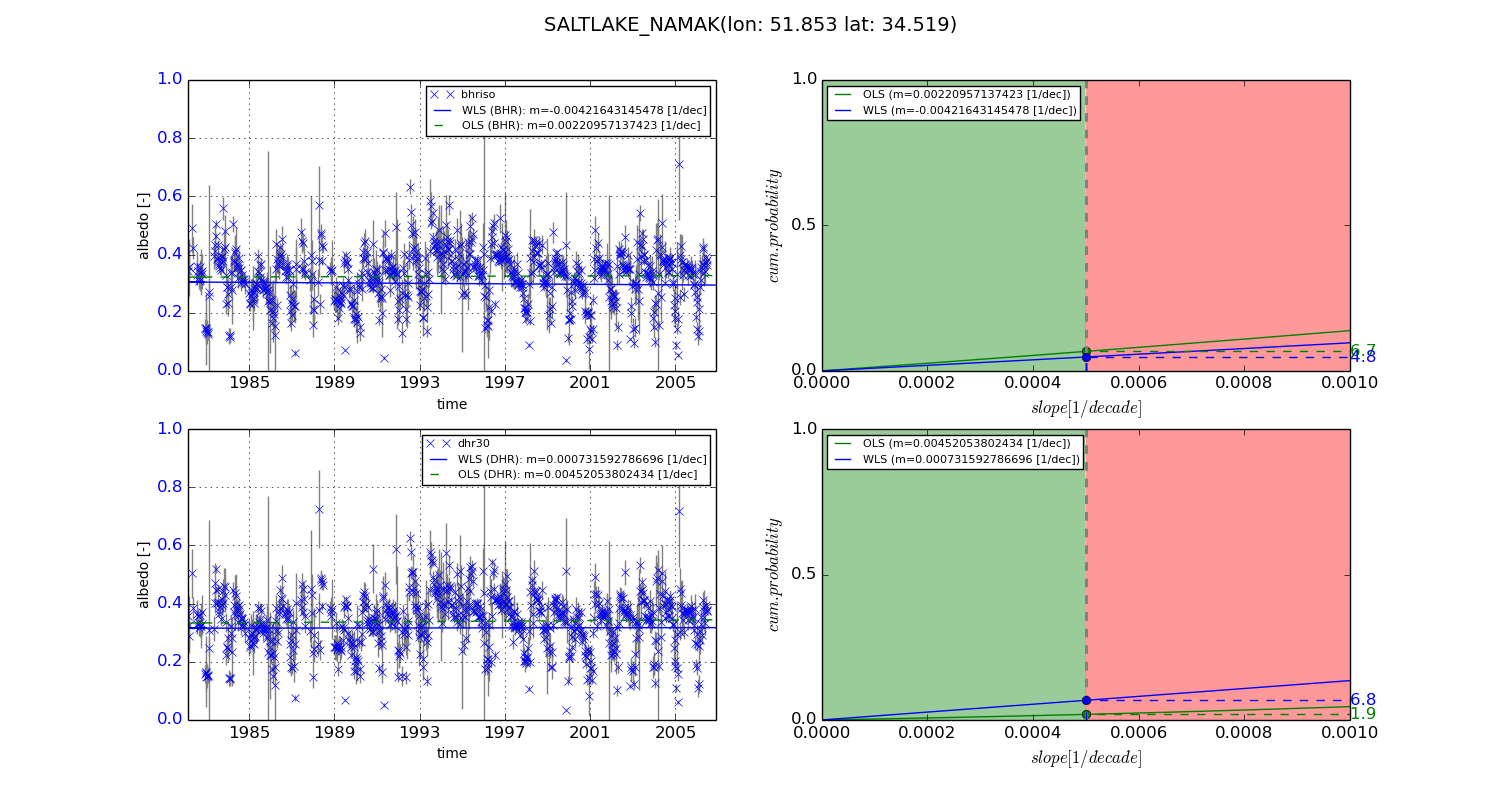
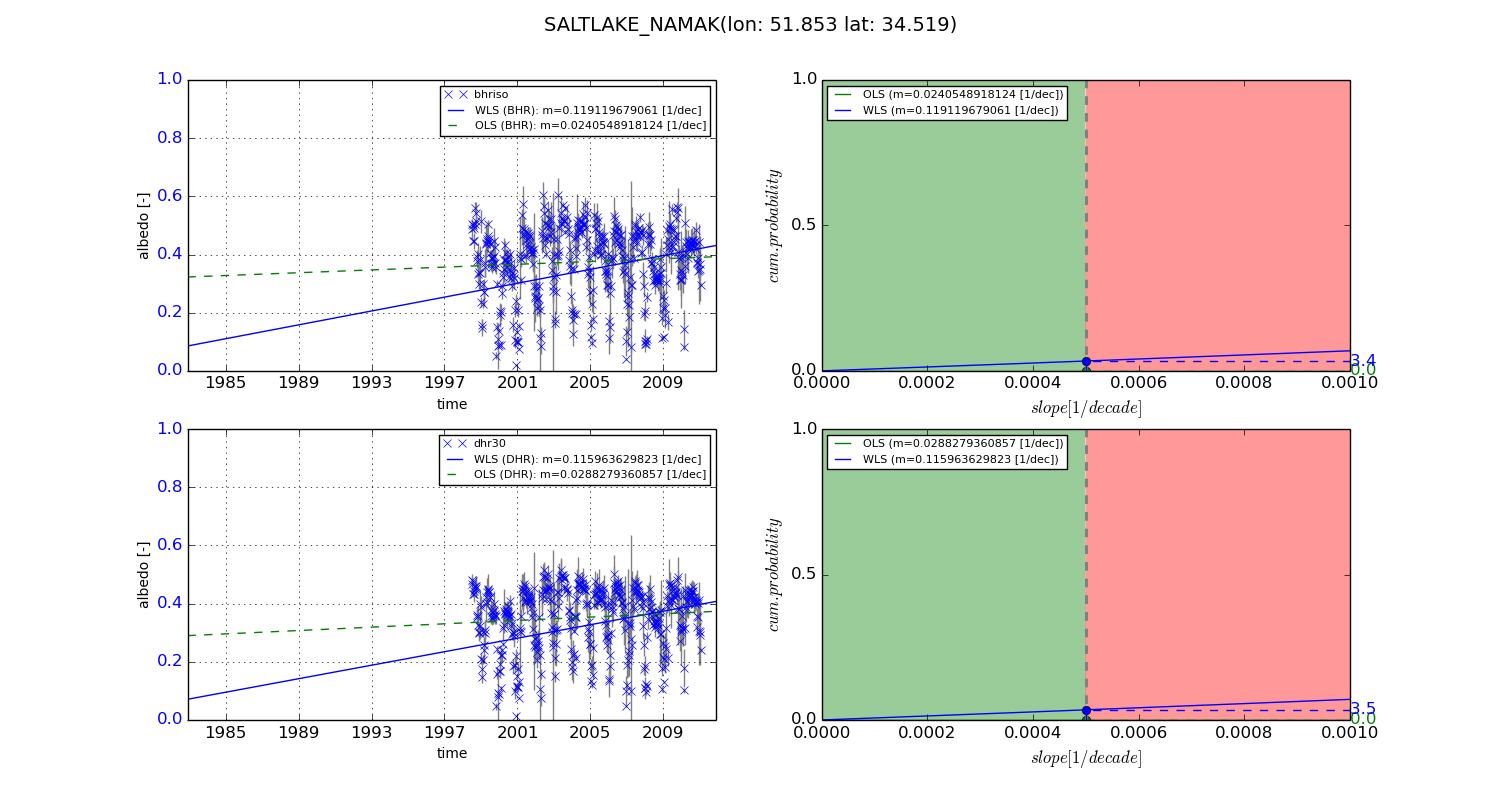
Temporal stability analysis

+000 deg (BHR)


BHR statistics

Temporal stability [1/decade]:


abs

rel


Weighted least square:

-0.00421643145478


Ordinary least square:

0.00220957137423


Probabilities that GCOS criteria is met:

Weighted least square:

4.8 %

Ordinary least square:

6.7 %


DHR statistics

Temporal stability [1/decade]:


abs

rel


Weighted least square:

0.000731592786696


Ordinary least square:

0.00452053802434


Probabilities that GCOS criteria is met:

Weighted least square:

6.8 %

Ordinary least square:

1.9 %


+057/+063 deg (BHR)


BHR statistics

Temporal stability [1/decade]:


abs

rel


Weighted least square:

0.119119679061


Ordinary least square:

0.0240548918124


Probabilities that GCOS criteria is met:

Weighted least square:

3.4 %

Ordinary least square:

0.0 %


DHR statistics

Temporal stability [1/decade]:


abs

rel


Weighted least square:

0.115963629823


Ordinary least square:

0.0288279360857


Probabilities that GCOS criteria is met:

Weighted least square:

3.5 %

Ordinary least square:

0.0 %


Temporal anomaly analyis

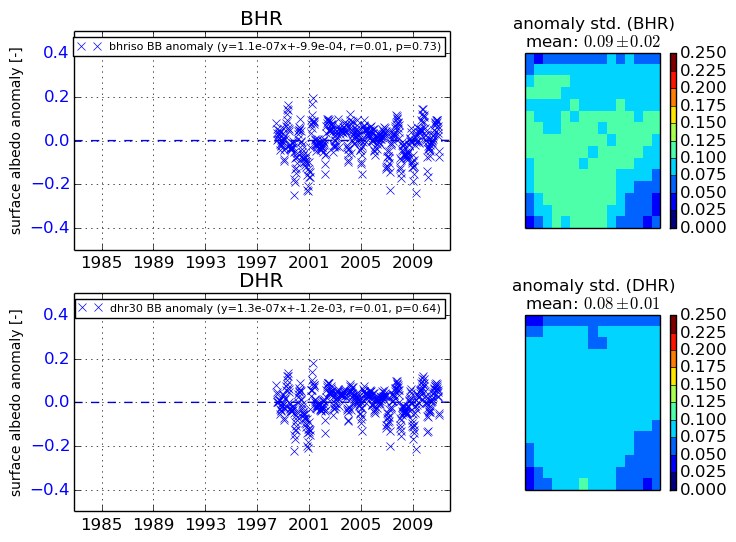
The variance of the temporal anomalies provides an additional measure about the stability of the signal AFTER removal of the mean seasonal cylce.
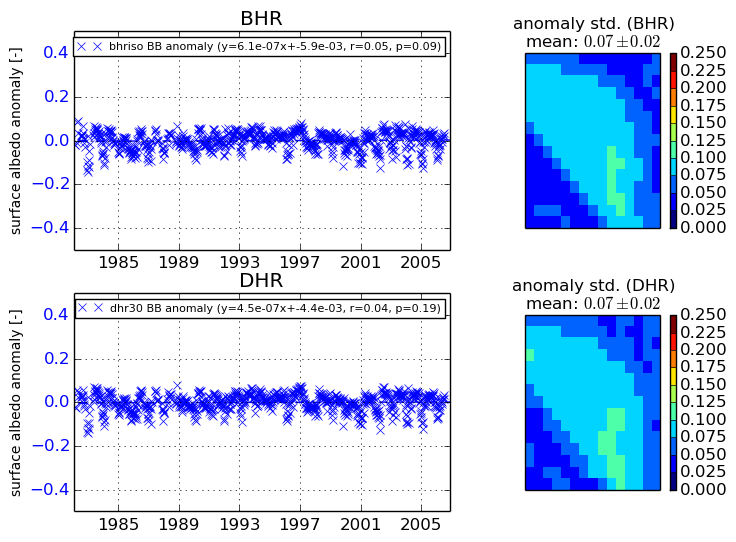
+000 deg


+057/+063 deg