SANTAREM


Location

lon / lat [deg]: -54.75 / -2.4333

Source network: AERONET


Geostationary surface albedo (GSA) data


“+000”


“+057/+063”


Landcover information (based on ESA CCI landcover data)


Landcover fractions @ 2km distance


Landcover fractions @ 20 km distance


Legend


Distance to open water bodies [km]:

0.22

Distance to urban areas [km]:

0.22


Radius: 1 km

Number of landcover classes:

3

Dominant landcover type:

190: urban areas

Fraction of dominant landcover type [%]:

53.0


Radius: 2 km

Number of landcover classes:

4

Dominant landcover type:

190: urban areas

Fraction of dominant landcover type [%]:

51.0


Radius: 5 km

Number of landcover classes:

7

Dominant landcover type:

210: water bodies

Fraction of dominant landcover type [%]:

38.0


Radius: 10 km

Number of landcover classes:

7

Dominant landcover type:

210: water bodies

Fraction of dominant landcover type [%]:

43.0


Radius: 20 km

Number of landcover classes:

7

Dominant landcover type:

210: water bodies

Fraction of dominant landcover type [%]:

48.0


Disturbances


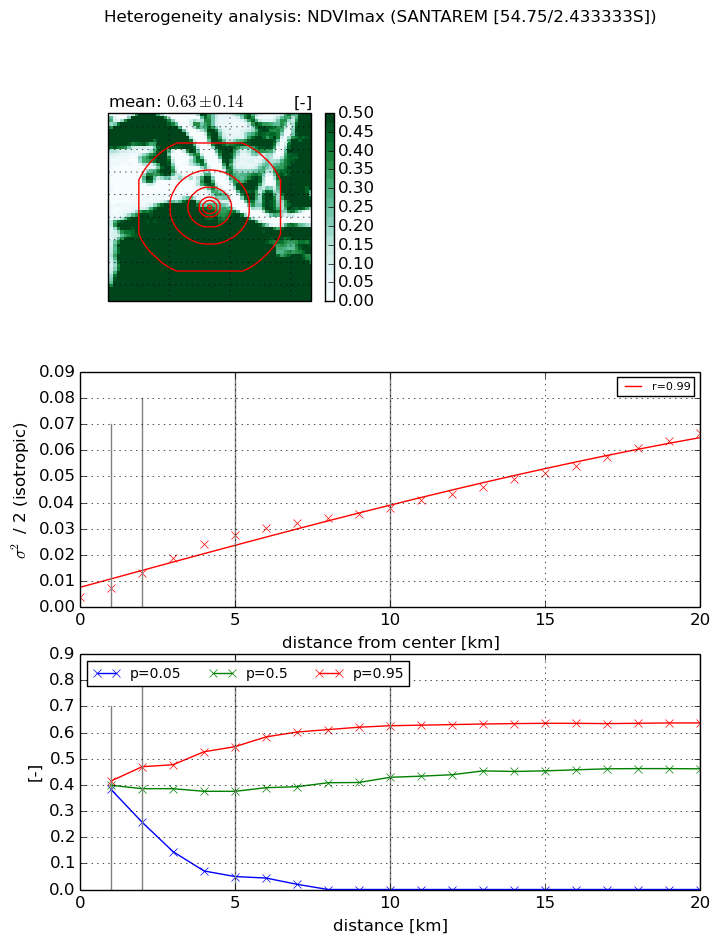
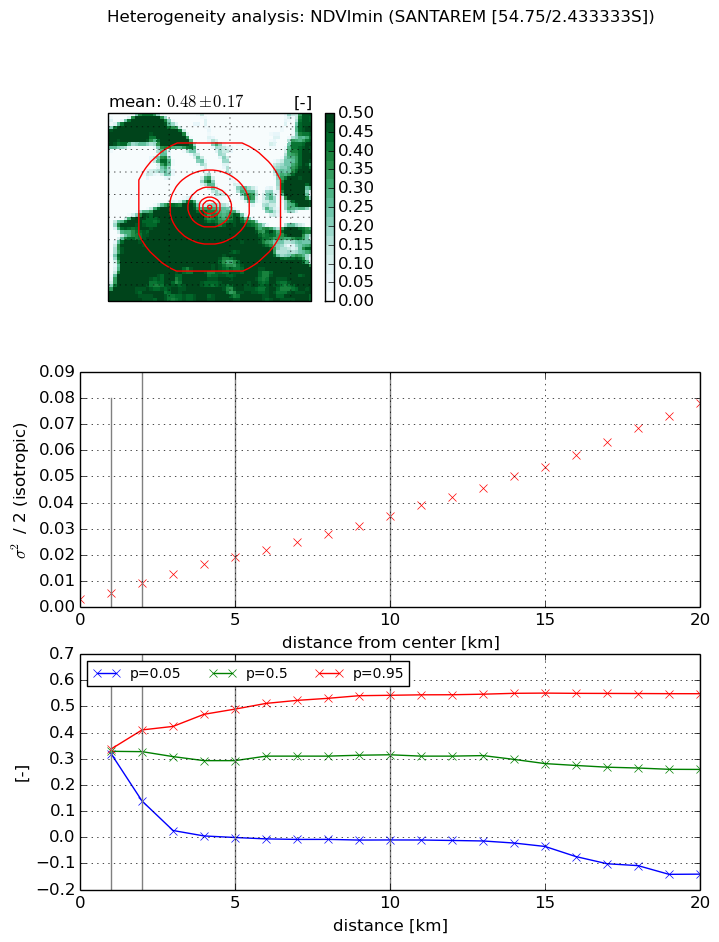
Heterogeneity analysis

The heterogeneity analysis provides information about the spatial and temporal heterogeneity of the site.

Topography


Roman et al. (2009) index


St

2.2669749908

Rcv

0.553754414294

Rse

0.0

Rst

-1.38524303707e-06

Rsv

-0.769593603157


Height range @ 1km [m]

16

Height range @ 2km [m]

32

Height range @ 5km [m]

71

Height range @ 10km [m]

-999

Height range @ 20km [m]

-999


Variance slope @ 1 km

21

Variance slope @ 2 km

42

Variance slope @ 5 km

105

Variance slope @ 10 km

-999

Variance slope @ 20 km

-999


NDVI (max. NDVI composite)


Roman et al. (2009) index


St

0.017330710894

Rcv

0.426748003059

Rse

0.0

Rst

0.13341199162

Rsv

172.542952645


NDVI range @ 1km [-]

0.03

NDVI range @ 2km [-]

0.21

NDVI range @ 5km [-]

0.5

NDVI range @ 10km [-]

0.63

NDVI range @ 20km [-]

0.64


Variance slope @ 1 km

0.00345093163469

Variance slope @ 2 km

0.00474081241987

Variance slope @ 5 km

0.00502149472519

Variance slope @ 10 km

0.00345283011845

Variance slope @ 20 km

0.00289540750417


NDVI (min. NDVI composite)I


Roman et al. (2009) index


St

8.89351594682e-07

Rcv

0.326166065062

Rse

0.0

Rst

0.142996203152

Rsv

3373243.60881


NDVI range @ 1km [-]

0.02

NDVI range @ 2km [-]

0.27

NDVI range @ 5km [-]

0.49

NDVI range @ 10km [-]

0.55

NDVI range @ 20km [-]

0.69


NDVI slope @ 1 km

0.00231412390677

NDVI slope @ 2 km

0.00305837153744

NDVI slope @ 5 km

0.00334394562027

NDVI slope @ 10 km

0.00315082402898

NDVI slope @ 20 km

0.00366902345713


Temporal stability analysis

+000 deg (BHR)


BHR statistics

Temporal stability [1/decade]:


abs

rel


Weighted least square:

-99999.0


Ordinary least square:

-99999.0


Probabilities that GCOS criteria is met:

Weighted least square:

-99999.0 %

Ordinary least square:

-99999.0 %


DHR statistics

Temporal stability [1/decade]:


abs

rel


Weighted least square:

-99999.0


Ordinary least square:

-99999.0


Probabilities that GCOS criteria is met:

Weighted least square:

-99999.0 %

Ordinary least square:

-99999.0 %


+057/+063 deg (BHR)


BHR statistics

Temporal stability [1/decade]:


abs

rel


Weighted least square:

None


Ordinary least square:

None


Probabilities that GCOS criteria is met:

Weighted least square:

None %

Ordinary least square:

None %


DHR statistics

Temporal stability [1/decade]:


abs

rel


Weighted least square:

None


Ordinary least square:

None


Probabilities that GCOS criteria is met:

Weighted least square:

None %

Ordinary least square:

None %


Temporal anomaly analyis

The variance of the temporal anomalies provides an additional measure about the stability of the signal AFTER removal of the mean seasonal cylce.

+000 deg


+057/+063 deg