SEVILLETA


Location

lon / lat [deg]: -106.885 / 34.3547

Source network: AERONET


Geostationary surface albedo (GSA) data


“+000”


“+057/+063”


Landcover information (based on ESA CCI landcover data)


Landcover fractions @ 2km distance


Landcover fractions @ 20 km distance


Legend


Distance to open water bodies [km]:

1.31

Distance to urban areas [km]:

0.88


Radius: 1 km

Number of landcover classes:

3

Dominant landcover type:

120: Shrubland

Fraction of dominant landcover type [%]:

90.0


Radius: 2 km

Number of landcover classes:

4

Dominant landcover type:

120: Shrubland

Fraction of dominant landcover type [%]:

74.0


Radius: 5 km

Number of landcover classes:

5

Dominant landcover type:

120: Shrubland

Fraction of dominant landcover type [%]:

68.0


Radius: 10 km

Number of landcover classes:

4

Dominant landcover type:

120: Shrubland

Fraction of dominant landcover type [%]:

76.0


Radius: 20 km

Number of landcover classes:

3

Dominant landcover type:

120: Shrubland

Fraction of dominant landcover type [%]:

72.0


Disturbances


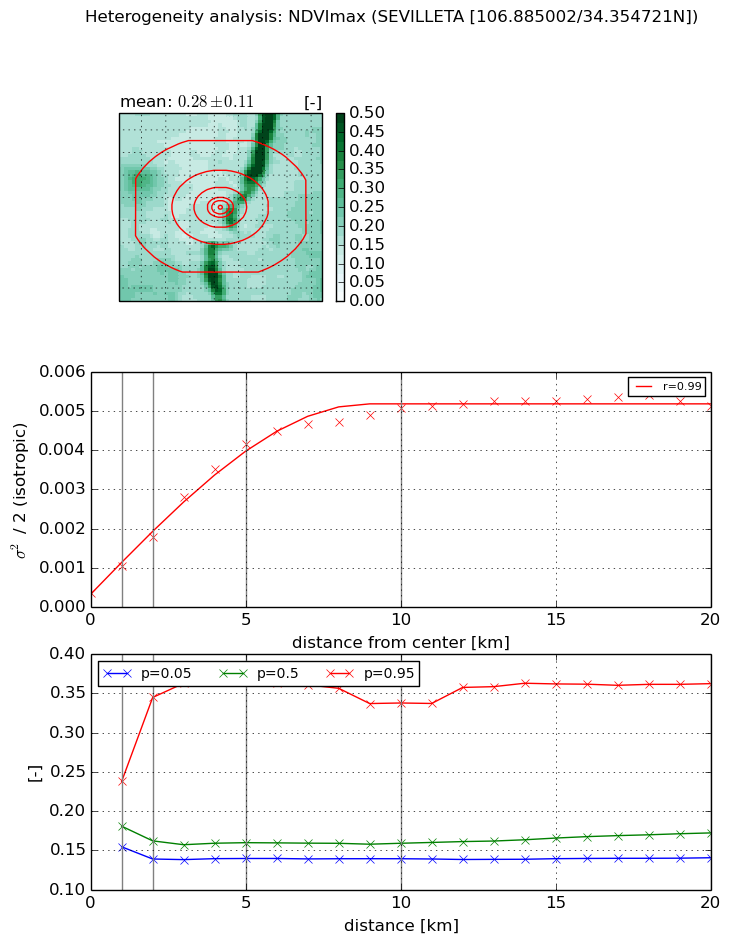
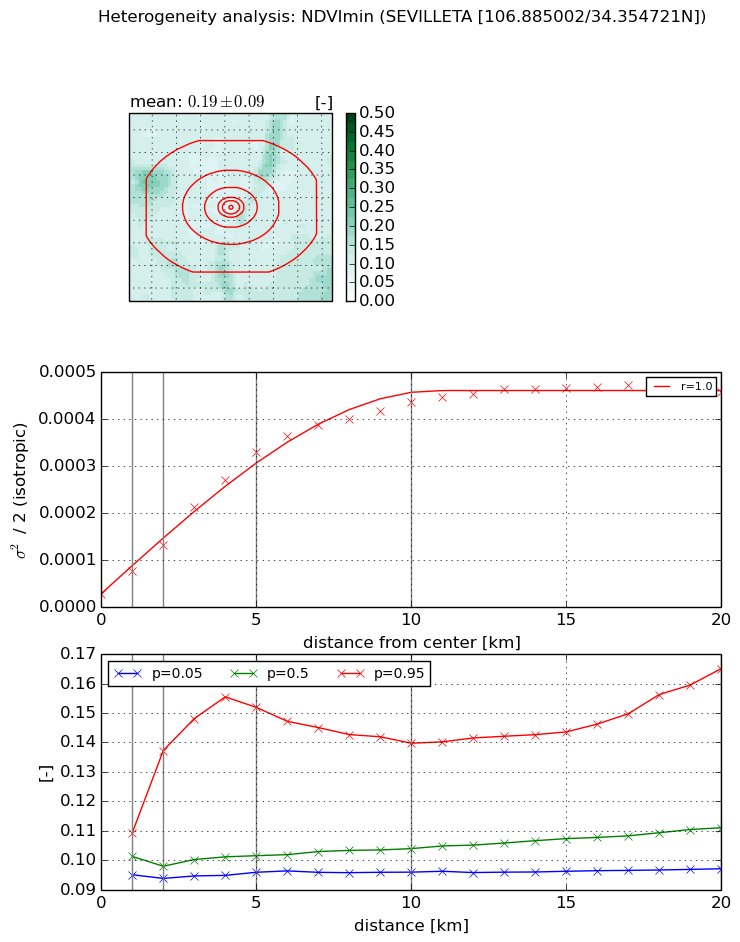
Heterogeneity analysis

The heterogeneity analysis provides information about the spatial and temporal heterogeneity of the site.

Topography


Roman et al. (2009) index


St

8.81493840926

Rcv

0.0076659887939

Rse

0.0

Rst

-1.86778098065e-07

Rsv

-0.332665187021


Height range @ 1km [m]

70

Height range @ 2km [m]

99

Height range @ 5km [m]

108

Height range @ 10km [m]

-999

Height range @ 20km [m]

-999


Variance slope @ 1 km

141

Variance slope @ 2 km

190

Variance slope @ 5 km

300

Variance slope @ 10 km

-999

Variance slope @ 20 km

-999


NDVI (max. NDVI composite)


Roman et al. (2009) index


St

8.20710304697

Rcv

-0.0325410392183

Rse

0.0

Rst

-0.110543030575

Rsv

0.222452951349


NDVI range @ 1km [-]

0.08

NDVI range @ 2km [-]

0.21

NDVI range @ 5km [-]

0.23

NDVI range @ 10km [-]

0.2

NDVI range @ 20km [-]

0.22


Variance slope @ 1 km

0.000681686475335

Variance slope @ 2 km

0.0007067757863

Variance slope @ 5 km

0.000785485463352

Variance slope @ 10 km

0.000477433733593

Variance slope @ 20 km

0.000200801192177


NDVI (min. NDVI composite)I


Roman et al. (2009) index


St

6.09846196662

Rcv

-0.00893884932288

Rse

0.0

Rst

0.0407922183619

Rsv

0.442196243893


NDVI range @ 1km [-]

0.01

NDVI range @ 2km [-]

0.04

NDVI range @ 5km [-]

0.06

NDVI range @ 10km [-]

0.04

NDVI range @ 20km [-]

0.07


NDVI slope @ 1 km

4.90045093222e-05

NDVI slope @ 2 km

5.20571485249e-05

NDVI slope @ 5 km

6.16449094433e-05

NDVI slope @ 10 km

4.22531815091e-05

NDVI slope @ 20 km

1.94854818166e-05


Temporal stability analysis

+000 deg (BHR)


BHR statistics

Temporal stability [1/decade]:


abs

rel


Weighted least square:

None


Ordinary least square:

None


Probabilities that GCOS criteria is met:

Weighted least square:

None %

Ordinary least square:

None %


DHR statistics

Temporal stability [1/decade]:


abs

rel


Weighted least square:

None


Ordinary least square:

None


Probabilities that GCOS criteria is met:

Weighted least square:

None %

Ordinary least square:

None %


+057/+063 deg (BHR)


BHR statistics

Temporal stability [1/decade]:


abs

rel


Weighted least square:

None


Ordinary least square:

None


Probabilities that GCOS criteria is met:

Weighted least square:

None %

Ordinary least square:

None %


DHR statistics

Temporal stability [1/decade]:


abs

rel


Weighted least square:

None


Ordinary least square:

None


Probabilities that GCOS criteria is met:

Weighted least square:

None %

Ordinary least square:

None %


Temporal anomaly analyis

The variance of the temporal anomalies provides an additional measure about the stability of the signal AFTER removal of the mean seasonal cylce.

+000 deg


+057/+063 deg