SEYSSES


Location

lon / lat [deg]: 1.2597 / 43.5033

Source network: AERONET


Geostationary surface albedo (GSA) data


“+000”


“+057/+063”


Landcover information (based on ESA CCI landcover data)


Landcover fractions @ 2km distance


Landcover fractions @ 20 km distance


Legend


Distance to open water bodies [km]:

3.27

Distance to urban areas [km]:

0.09


Radius: 1 km

Number of landcover classes:

2

Dominant landcover type:

10: cropland, rainfed

Fraction of dominant landcover type [%]:

80.0


Radius: 2 km

Number of landcover classes:

2

Dominant landcover type:

10: cropland, rainfed

Fraction of dominant landcover type [%]:

94.0


Radius: 5 km

Number of landcover classes:

3

Dominant landcover type:

10: cropland, rainfed

Fraction of dominant landcover type [%]:

85.0


Radius: 10 km

Number of landcover classes:

3

Dominant landcover type:

10: cropland, rainfed

Fraction of dominant landcover type [%]:

72.0


Radius: 20 km

Number of landcover classes:

5

Dominant landcover type:

10: cropland, rainfed

Fraction of dominant landcover type [%]:

72.0


Disturbances


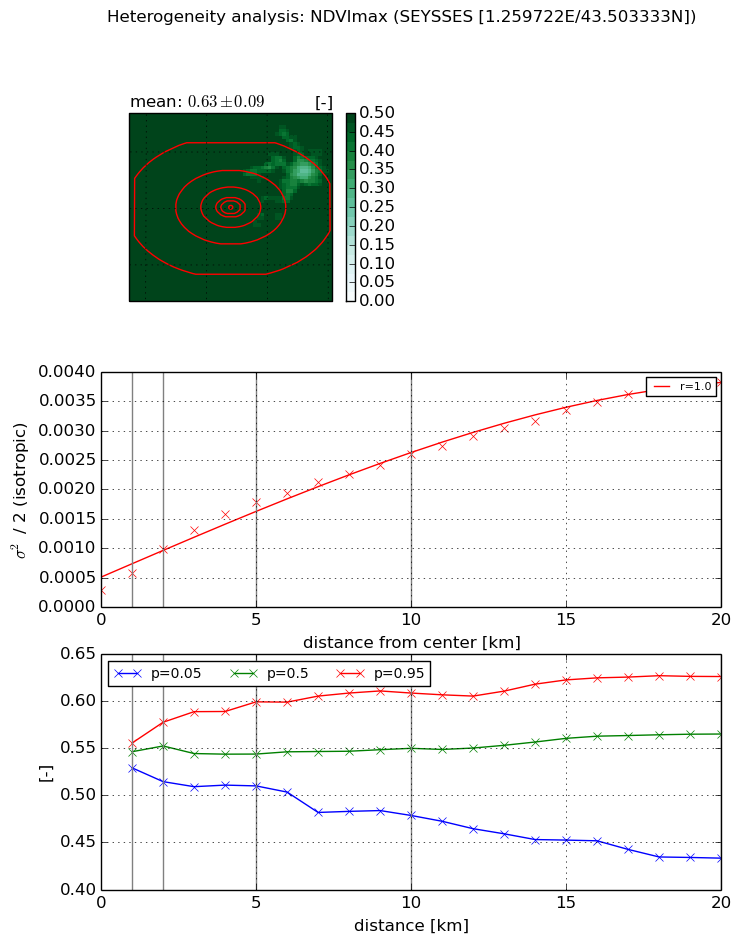
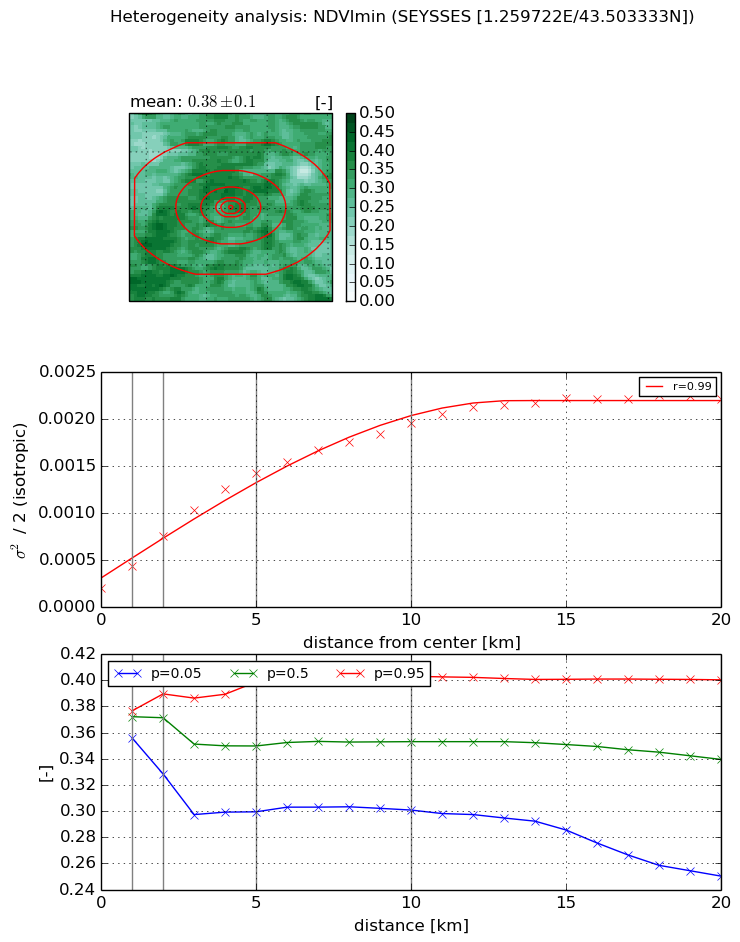
Heterogeneity analysis

The heterogeneity analysis provides information about the spatial and temporal heterogeneity of the site.

Topography


Roman et al. (2009) index


St

2.1999803483e-09

Rcv

2.27984842305

Rse

0.0

Rst

-7.29139415512e-10

Rsv

1363648542.27


Height range @ 1km [m]

5

Height range @ 2km [m]

7

Height range @ 5km [m]

38

Height range @ 10km [m]

-999

Height range @ 20km [m]

-999


Variance slope @ 1 km

32

Variance slope @ 2 km

32

Variance slope @ 5 km

29

Variance slope @ 10 km

-999

Variance slope @ 20 km

-999


NDVI (max. NDVI composite)


Roman et al. (2009) index


St

nan

Rcv

nan

Rse

nan

Rst

nan

Rsv

nan


NDVI range @ 1km [-]

0.03

NDVI range @ 2km [-]

0.06

NDVI range @ 5km [-]

0.09

NDVI range @ 10km [-]

0.13

NDVI range @ 20km [-]

0.19


Variance slope @ 1 km

0.000299375987447

Variance slope @ 2 km

0.000348722754073

Variance slope @ 5 km

0.000308282230456

Variance slope @ 10 km

0.00022465913602

Variance slope @ 20 km

0.000170744559904


NDVI (min. NDVI composite)I


Roman et al. (2009) index


St

3.08427112683

Rcv

0.0254365087008

Rse

0.0

Rst

-0.207153396626

Rsv

0.740087228634


NDVI range @ 1km [-]

0.02

NDVI range @ 2km [-]

0.06

NDVI range @ 5km [-]

0.1

NDVI range @ 10km [-]

0.1

NDVI range @ 20km [-]

0.15


NDVI slope @ 1 km

0.000232567019932

NDVI slope @ 2 km

0.0002763309559

NDVI slope @ 5 km

0.000253191967631

NDVI slope @ 10 km

0.000172363301087

NDVI slope @ 20 km

9.25007352011e-05


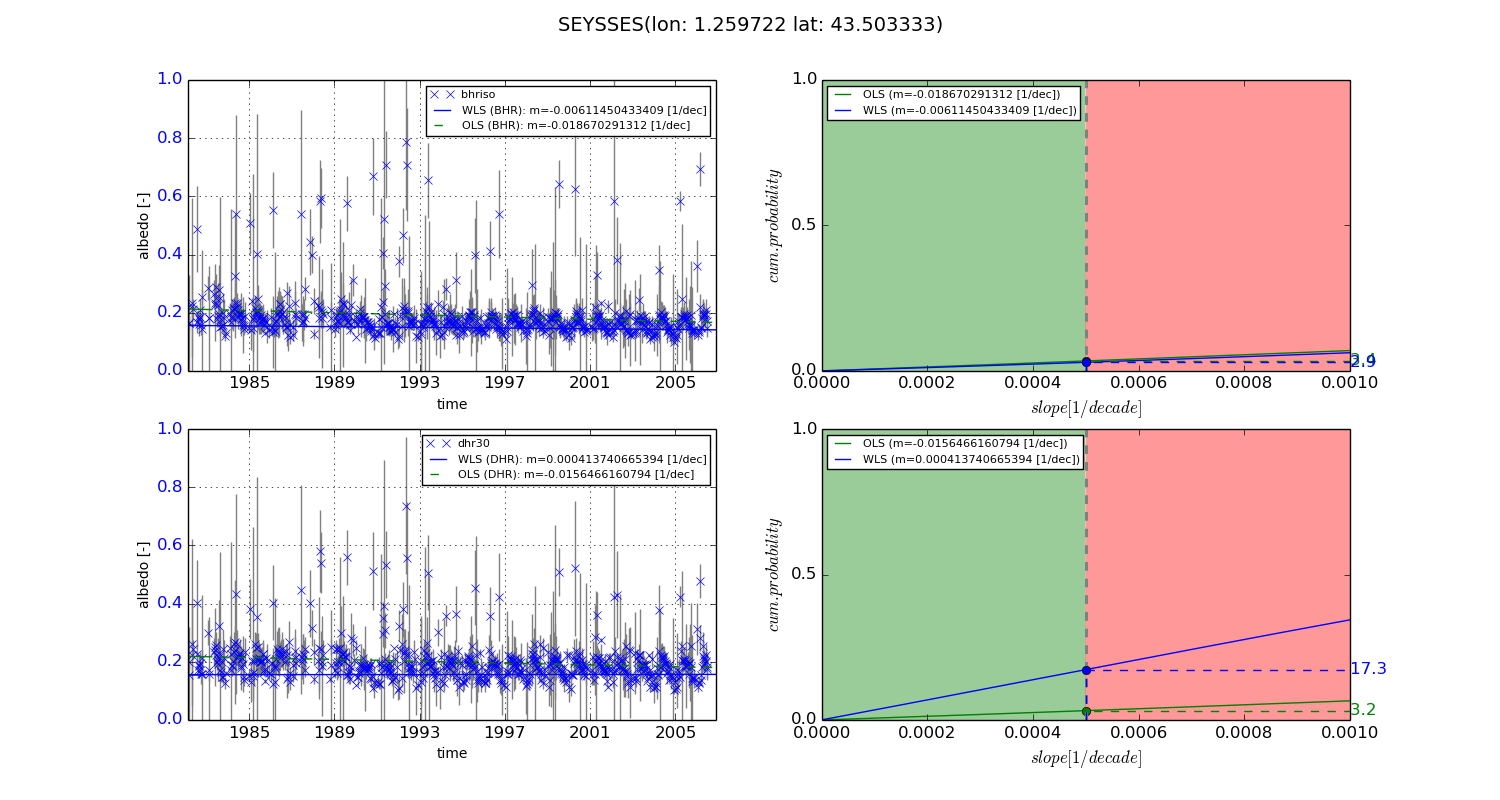
Temporal stability analysis

+000 deg (BHR)


BHR statistics

Temporal stability [1/decade]:


abs

rel


Weighted least square:

-0.00611450433409


Ordinary least square:

-0.018670291312


Probabilities that GCOS criteria is met:

Weighted least square:

2.9 %

Ordinary least square:

3.4 %


DHR statistics

Temporal stability [1/decade]:


abs

rel


Weighted least square:

0.000413740665394


Ordinary least square:

-0.0156466160794


Probabilities that GCOS criteria is met:

Weighted least square:

17.3 %

Ordinary least square:

3.2 %


+057/+063 deg (BHR)


BHR statistics

Temporal stability [1/decade]:


abs

rel


Weighted least square:

-99999.0


Ordinary least square:

-99999.0


Probabilities that GCOS criteria is met:

Weighted least square:

-99999.0 %

Ordinary least square:

-99999.0 %


DHR statistics

Temporal stability [1/decade]:


abs

rel


Weighted least square:

-99999.0


Ordinary least square:

-99999.0


Probabilities that GCOS criteria is met:

Weighted least square:

-99999.0 %

Ordinary least square:

-99999.0 %


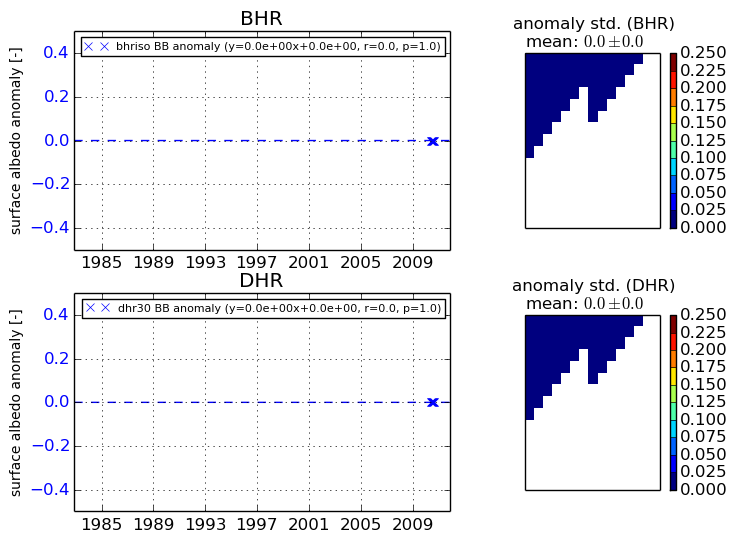
Temporal anomaly analyis

The variance of the temporal anomalies provides an additional measure about the stability of the signal AFTER removal of the mean seasonal cylce.
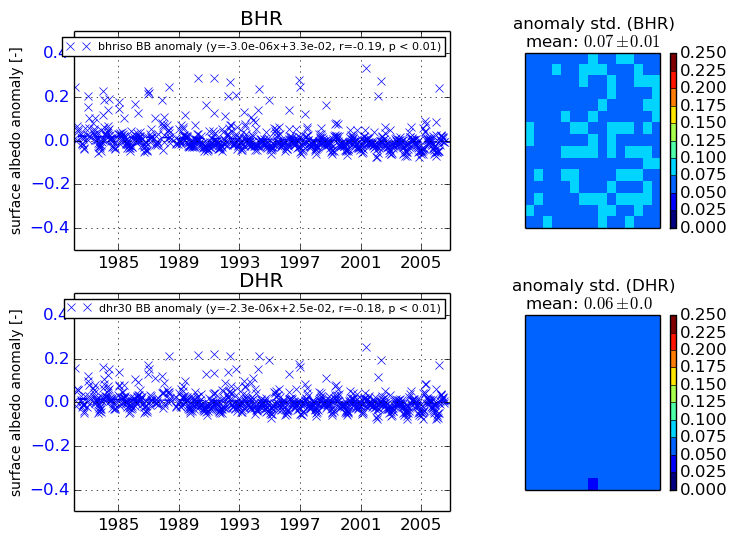
+000 deg


+057/+063 deg