SHELTON


Location

lon / lat [deg]: -98.7603 / 40.7501

Source network: AERONET


Geostationary surface albedo (GSA) data


“+000”


“+057/+063”


Landcover information (based on ESA CCI landcover data)


Landcover fractions @ 2km distance


Landcover fractions @ 20 km distance


Legend


Distance to open water bodies [km]:

3.91

Distance to urban areas [km]:

6.76


Radius: 1 km

Number of landcover classes:

1

Dominant landcover type:

10: cropland, rainfed

Fraction of dominant landcover type [%]:

100.0


Radius: 2 km

Number of landcover classes:

2

Dominant landcover type:

10: cropland, rainfed

Fraction of dominant landcover type [%]:

87.0


Radius: 5 km

Number of landcover classes:

4

Dominant landcover type:

10: cropland, rainfed

Fraction of dominant landcover type [%]:

76.0


Radius: 10 km

Number of landcover classes:

4

Dominant landcover type:

10: cropland, rainfed

Fraction of dominant landcover type [%]:

80.0


Radius: 20 km

Number of landcover classes:

2

Dominant landcover type:

10: cropland, rainfed

Fraction of dominant landcover type [%]:

78.0


Disturbances


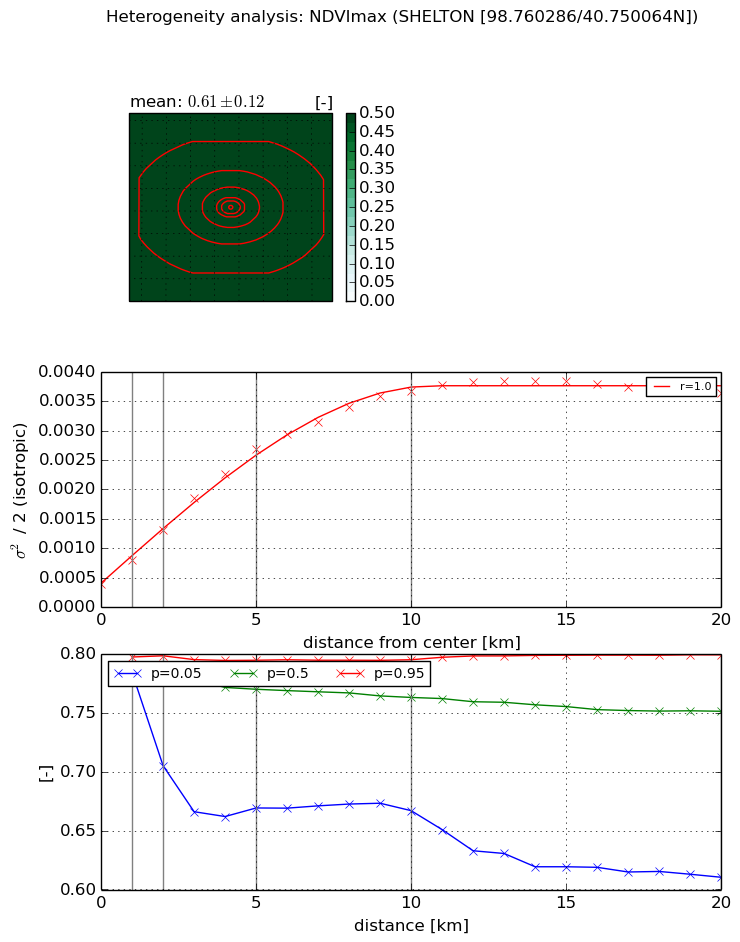
Heterogeneity analysis

The heterogeneity analysis provides information about the spatial and temporal heterogeneity of the site.

Topography


Roman et al. (2009) index


St

1.61180778609

Rcv

0.383139536924

Rse

0.0

Rst

2.61085946282e-08

Rsv

1.4781245566


Height range @ 1km [m]

4

Height range @ 2km [m]

7

Height range @ 5km [m]

13

Height range @ 10km [m]

-999

Height range @ 20km [m]

-999


Variance slope @ 1 km

1

Variance slope @ 2 km

1

Variance slope @ 5 km

2

Variance slope @ 10 km

-999

Variance slope @ 20 km

-999


NDVI (max. NDVI composite)


Roman et al. (2009) index


St

6.27017943117

Rcv

0.00274400082642

Rse

0.0

Rst

-0.0903919477933

Rsv

0.385319258752


NDVI range @ 1km [-]

0.01

NDVI range @ 2km [-]

0.09

NDVI range @ 5km [-]

0.13

NDVI range @ 10km [-]

0.13

NDVI range @ 20km [-]

0.19


Variance slope @ 1 km

0.000403293771973

Variance slope @ 2 km

0.00045246074934

Variance slope @ 5 km

0.000467840040076

Variance slope @ 10 km

0.00033708534432

Variance slope @ 20 km

0.000146549192187


NDVI (min. NDVI composite)I


Roman et al. (2009) index


St

1.05590060652

Rcv

0.0338677865117

Rse

0.0

Rst

0.558822795795

Rsv

2.24848592756


NDVI range @ 1km [-]

0.0

NDVI range @ 2km [-]

0.01

NDVI range @ 5km [-]

0.02

NDVI range @ 10km [-]

0.03

NDVI range @ 20km [-]

0.04


NDVI slope @ 1 km

1.64127277605e-05

NDVI slope @ 2 km

1.68773911973e-05

NDVI slope @ 5 km

1.26195631395e-05

NDVI slope @ 10 km

8.93495079166e-06

NDVI slope @ 20 km

4.67188177509e-06


Temporal stability analysis

+000 deg (BHR)


BHR statistics

Temporal stability [1/decade]:


abs

rel


Weighted least square:

None


Ordinary least square:

None


Probabilities that GCOS criteria is met:

Weighted least square:

None %

Ordinary least square:

None %


DHR statistics

Temporal stability [1/decade]:


abs

rel


Weighted least square:

None


Ordinary least square:

None


Probabilities that GCOS criteria is met:

Weighted least square:

None %

Ordinary least square:

None %


+057/+063 deg (BHR)


BHR statistics

Temporal stability [1/decade]:


abs

rel


Weighted least square:

None


Ordinary least square:

None


Probabilities that GCOS criteria is met:

Weighted least square:

None %

Ordinary least square:

None %


DHR statistics

Temporal stability [1/decade]:


abs

rel


Weighted least square:

None


Ordinary least square:

None


Probabilities that GCOS criteria is met:

Weighted least square:

None %

Ordinary least square:

None %


Temporal anomaly analyis

The variance of the temporal anomalies provides an additional measure about the stability of the signal AFTER removal of the mean seasonal cylce.

+000 deg


+057/+063 deg