SIOUX_FALLS_X


Location

lon / lat [deg]: -96.626 / 43.7363

Source network: AERONET


Geostationary surface albedo (GSA) data


“+000”


“+057/+063”


Landcover information (based on ESA CCI landcover data)


Landcover fractions @ 2km distance


Landcover fractions @ 20 km distance


Legend


Distance to open water bodies [km]:

17.68

Distance to urban areas [km]:

9.81


Radius: 1 km

Number of landcover classes:

3

Dominant landcover type:

130: grassland

Fraction of dominant landcover type [%]:

49.0


Radius: 2 km

Number of landcover classes:

3

Dominant landcover type:

10: cropland, rainfed

Fraction of dominant landcover type [%]:

84.0


Radius: 5 km

Number of landcover classes:

3

Dominant landcover type:

10: cropland, rainfed

Fraction of dominant landcover type [%]:

93.0


Radius: 10 km

Number of landcover classes:

3

Dominant landcover type:

10: cropland, rainfed

Fraction of dominant landcover type [%]:

89.0


Radius: 20 km

Number of landcover classes:

4

Dominant landcover type:

10: cropland, rainfed

Fraction of dominant landcover type [%]:

84.0


Disturbances


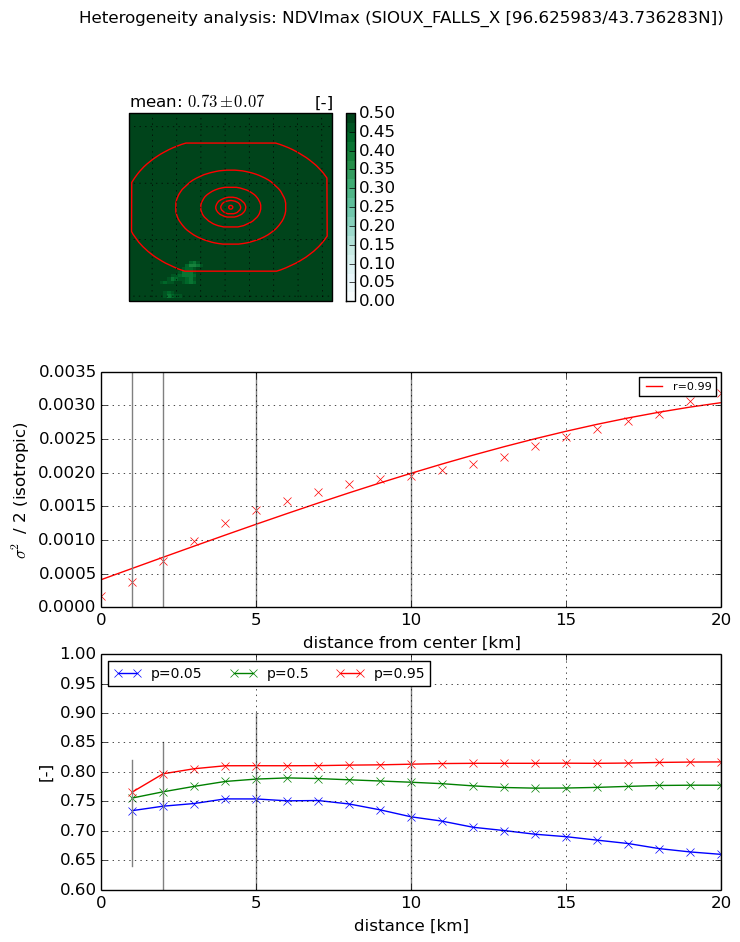
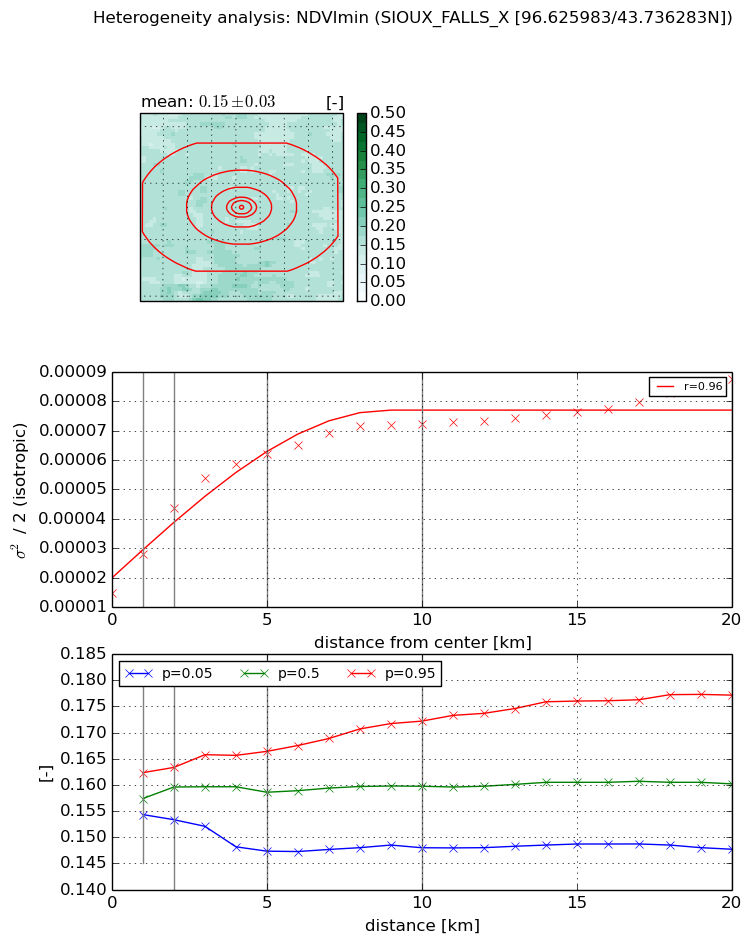
Heterogeneity analysis

The heterogeneity analysis provides information about the spatial and temporal heterogeneity of the site.

Topography


Roman et al. (2009) index


St

2.15545654821

Rcv

0.391816455336

Rse

0.0

Rst

5.02386992822e-08

Rsv

-0.999999999608


Height range @ 1km [m]

17

Height range @ 2km [m]

25

Height range @ 5km [m]

39

Height range @ 10km [m]

-999

Height range @ 20km [m]

-999


Variance slope @ 1 km

37

Variance slope @ 2 km

33

Variance slope @ 5 km

30

Variance slope @ 10 km

-999

Variance slope @ 20 km

-999


NDVI (max. NDVI composite)


Roman et al. (2009) index


St

11.5476088007

Rcv

-0.0593411737735

Rse

0.0

Rst

-0.0219386838998

Rsv

0.178514187292


NDVI range @ 1km [-]

0.03

NDVI range @ 2km [-]

0.06

NDVI range @ 5km [-]

0.06

NDVI range @ 10km [-]

0.09

NDVI range @ 20km [-]

0.16


Variance slope @ 1 km

0.000203030487778

Variance slope @ 2 km

0.000257274719738

Variance slope @ 5 km

0.000266819559603

Variance slope @ 10 km

0.000184718973314

Variance slope @ 20 km

0.000134703486637


NDVI (min. NDVI composite)I


Roman et al. (2009) index


St

10.9150257883

Rcv

0.181918749406

Rse

0.0

Rst

-0.0494712588773

Rsv

0.0434604646508


NDVI range @ 1km [-]

0.01

NDVI range @ 2km [-]

0.01

NDVI range @ 5km [-]

0.02

NDVI range @ 10km [-]

0.02

NDVI range @ 20km [-]

0.03


NDVI slope @ 1 km

1.33969067789e-05

NDVI slope @ 2 km

1.44714333887e-05

NDVI slope @ 5 km

9.66513861417e-06

NDVI slope @ 10 km

5.30755272761e-06

NDVI slope @ 20 km

2.58336879498e-06


Temporal stability analysis

+000 deg (BHR)


BHR statistics

Temporal stability [1/decade]:


abs

rel


Weighted least square:

None


Ordinary least square:

None


Probabilities that GCOS criteria is met:

Weighted least square:

None %

Ordinary least square:

None %


DHR statistics

Temporal stability [1/decade]:


abs

rel


Weighted least square:

None


Ordinary least square:

None


Probabilities that GCOS criteria is met:

Weighted least square:

None %

Ordinary least square:

None %


+057/+063 deg (BHR)


BHR statistics

Temporal stability [1/decade]:


abs

rel


Weighted least square:

None


Ordinary least square:

None


Probabilities that GCOS criteria is met:

Weighted least square:

None %

Ordinary least square:

None %


DHR statistics

Temporal stability [1/decade]:


abs

rel


Weighted least square:

None


Ordinary least square:

None


Probabilities that GCOS criteria is met:

Weighted least square:

None %

Ordinary least square:

None %


Temporal anomaly analyis

The variance of the temporal anomalies provides an additional measure about the stability of the signal AFTER removal of the mean seasonal cylce.

+000 deg


+057/+063 deg