SPOKANE


Location

lon / lat [deg]: -117.5339 / 47.6197

Source network: AERONET


Geostationary surface albedo (GSA) data


“+000”


“+057/+063”


Landcover information (based on ESA CCI landcover data)


Landcover fractions @ 2km distance


Landcover fractions @ 20 km distance


Legend


Distance to open water bodies [km]:

2.47

Distance to urban areas [km]:

0.14


Radius: 1 km

Number of landcover classes:

3

Dominant landcover type:

190: urban areas

Fraction of dominant landcover type [%]:

65.0


Radius: 2 km

Number of landcover classes:

3

Dominant landcover type:

190: urban areas

Fraction of dominant landcover type [%]:

36.0


Radius: 5 km

Number of landcover classes:

4

Dominant landcover type:

130: grassland

Fraction of dominant landcover type [%]:

51.0


Radius: 10 km

Number of landcover classes:

5

Dominant landcover type:

130: grassland

Fraction of dominant landcover type [%]:

43.0


Radius: 20 km

Number of landcover classes:

6

Dominant landcover type:

130: grassland

Fraction of dominant landcover type [%]:

40.0


Disturbances


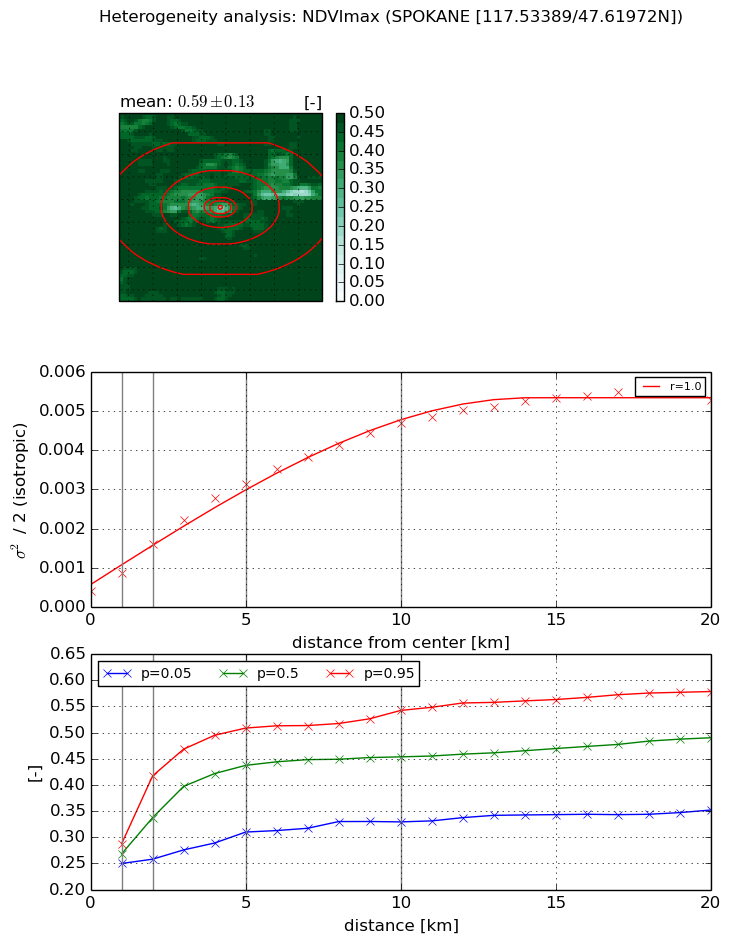
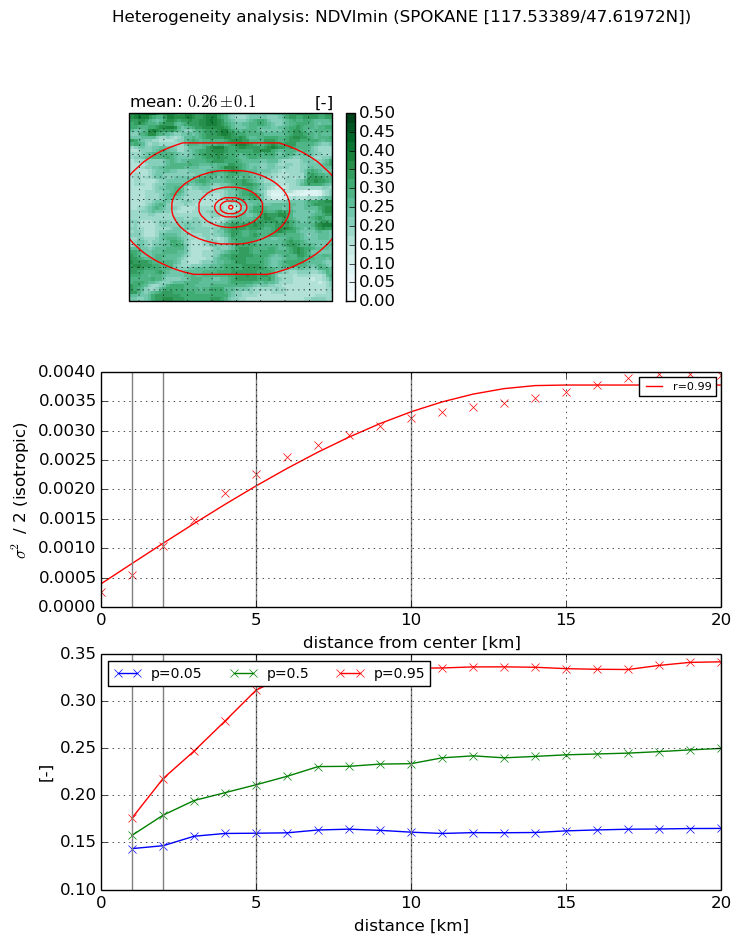
Heterogeneity analysis

The heterogeneity analysis provides information about the spatial and temporal heterogeneity of the site.

Topography


Roman et al. (2009) index


St

1.07546268955

Rcv

0.598789331336

Rse

0.0

Rst

1.99714773099e-05

Rsv

2.19068774729


Height range @ 1km [m]

11

Height range @ 2km [m]

22

Height range @ 5km [m]

45

Height range @ 10km [m]

-999

Height range @ 20km [m]

-999


Variance slope @ 1 km

58

Variance slope @ 2 km

48

Variance slope @ 5 km

55

Variance slope @ 10 km

-999

Variance slope @ 20 km

-999


NDVI (max. NDVI composite)


Roman et al. (2009) index


St

nan

Rcv

nan

Rse

nan

Rst

nan

Rsv

nan


NDVI range @ 1km [-]

0.04

NDVI range @ 2km [-]

0.16

NDVI range @ 5km [-]

0.2

NDVI range @ 10km [-]

0.21

NDVI range @ 20km [-]

0.23


Variance slope @ 1 km

0.000461758081092

Variance slope @ 2 km

0.000596674251223

Variance slope @ 5 km

0.000574211229706

Variance slope @ 10 km

0.000429875769643

Variance slope @ 20 km

0.000238369280805


NDVI (min. NDVI composite)I


Roman et al. (2009) index


St

3.20002488609

Rcv

0.40309882105

Rse

0.0

Rst

4.2456118281e-09

Rsv

0.534393883915


NDVI range @ 1km [-]

0.03

NDVI range @ 2km [-]

0.07

NDVI range @ 5km [-]

0.15

NDVI range @ 10km [-]

0.17

NDVI range @ 20km [-]

0.18


NDVI slope @ 1 km

0.000292500849618

NDVI slope @ 2 km

0.000395006237057

NDVI slope @ 5 km

0.000419279937054

NDVI slope @ 10 km

0.000306654857196

NDVI slope @ 20 km

0.000172959995485


Temporal stability analysis

+000 deg (BHR)


BHR statistics

Temporal stability [1/decade]:


abs

rel


Weighted least square:

None


Ordinary least square:

None


Probabilities that GCOS criteria is met:

Weighted least square:

None %

Ordinary least square:

None %


DHR statistics

Temporal stability [1/decade]:


abs

rel


Weighted least square:

None


Ordinary least square:

None


Probabilities that GCOS criteria is met:

Weighted least square:

None %

Ordinary least square:

None %


+057/+063 deg (BHR)


BHR statistics

Temporal stability [1/decade]:


abs

rel


Weighted least square:

None


Ordinary least square:

None


Probabilities that GCOS criteria is met:

Weighted least square:

None %

Ordinary least square:

None %


DHR statistics

Temporal stability [1/decade]:


abs

rel


Weighted least square:

None


Ordinary least square:

None


Probabilities that GCOS criteria is met:

Weighted least square:

None %

Ordinary least square:

None %


Temporal anomaly analyis

The variance of the temporal anomalies provides an additional measure about the stability of the signal AFTER removal of the mean seasonal cylce.

+000 deg


+057/+063 deg