STEAMBOATSPRING


Location

lon / lat [deg]: -106.8071 / 40.4049

Source network: AERONET


Geostationary surface albedo (GSA) data


“+000”


“+057/+063”


Landcover information (based on ESA CCI landcover data)


Landcover fractions @ 2km distance


Landcover fractions @ 20 km distance


Legend


Distance to open water bodies [km]:

2.76

Distance to urban areas [km]:

2.69


Radius: 1 km

Number of landcover classes:

2

Dominant landcover type:

130: grassland

Fraction of dominant landcover type [%]:

67.0


Radius: 2 km

Number of landcover classes:

5

Dominant landcover type:

130: grassland

Fraction of dominant landcover type [%]:

67.0


Radius: 5 km

Number of landcover classes:

4

Dominant landcover type:

130: grassland

Fraction of dominant landcover type [%]:

54.0


Radius: 10 km

Number of landcover classes:

4

Dominant landcover type:

70: Tree cover, needleleaved, evergreen, closed to open (>15%)

Fraction of dominant landcover type [%]:

56.0


Radius: 20 km

Number of landcover classes:

4

Dominant landcover type:

70: Tree cover, needleleaved, evergreen, closed to open (>15%)

Fraction of dominant landcover type [%]:

58.0


Disturbances


Heterogeneity analysis

The heterogeneity analysis provides information about the spatial and temporal heterogeneity of the site.

Topography


Roman et al. (2009) index


St

0.574030329275

Rcv

0.643521943436

Rse

0.0

Rst

3.81872095903e-08

Rsv

4.58268271002


Height range @ 1km [m]

46

Height range @ 2km [m]

233

Height range @ 5km [m]

647

Height range @ 10km [m]

-999

Height range @ 20km [m]

-999


Variance slope @ 1 km

6611

Variance slope @ 2 km

9265

Variance slope @ 5 km

12382

Variance slope @ 10 km

-999

Variance slope @ 20 km

-999


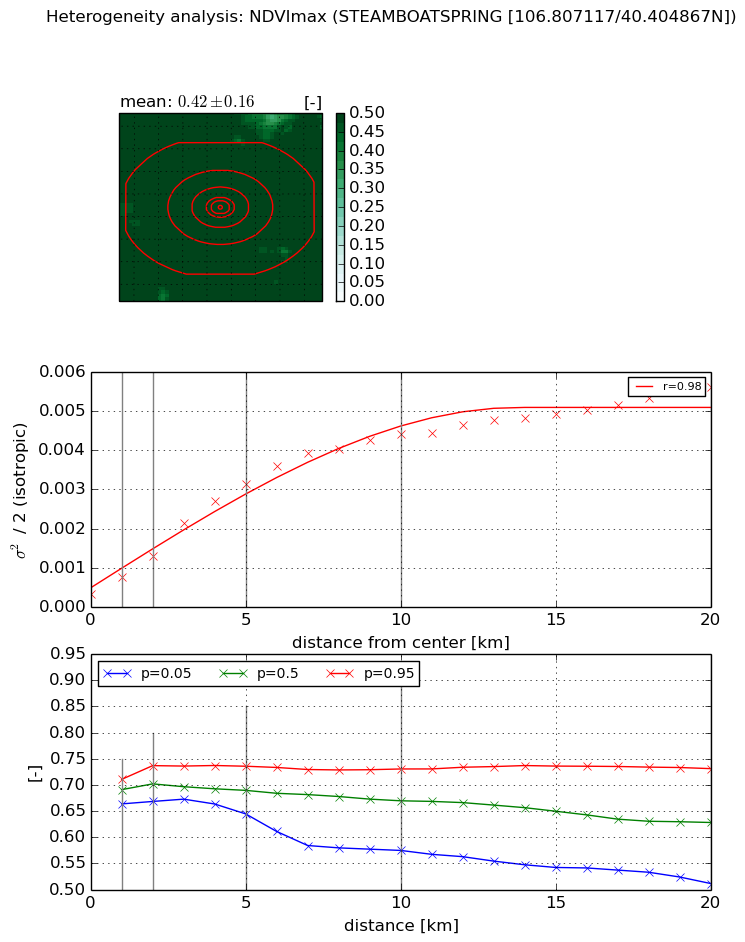
NDVI (max. NDVI composite)


Roman et al. (2009) index


St

1.45893429434

Rcv

0.4885391617

Rse

0.0

Rst

-0.315817140496

Rsv

1.25193918118


NDVI range @ 1km [-]

0.05

NDVI range @ 2km [-]

0.07

NDVI range @ 5km [-]

0.09

NDVI range @ 10km [-]

0.16

NDVI range @ 20km [-]

0.22


Variance slope @ 1 km

0.00043650139078

Variance slope @ 2 km

0.000483942727129

Variance slope @ 5 km

0.000591440768242

Variance slope @ 10 km

0.000426821699966

Variance slope @ 20 km

0.000234276137597


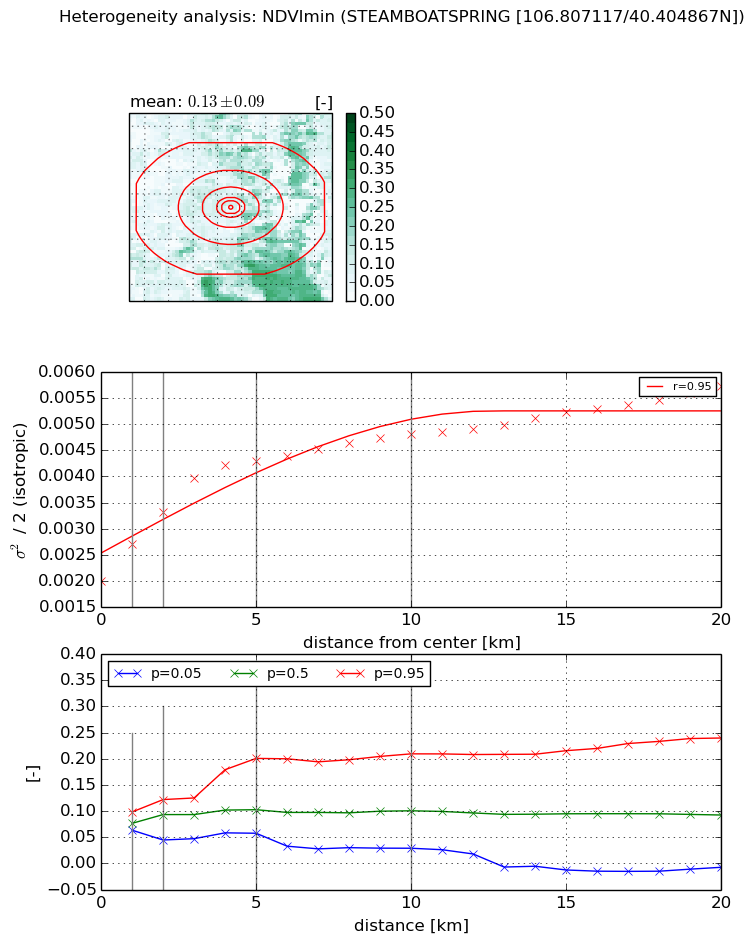
NDVI (min. NDVI composite)I


Roman et al. (2009) index


St

nan

Rcv

nan

Rse

nan

Rst

nan

Rsv

nan


NDVI range @ 1km [-]

0.03

NDVI range @ 2km [-]

0.08

NDVI range @ 5km [-]

0.14

NDVI range @ 10km [-]

0.18

NDVI range @ 20km [-]

0.25


NDVI slope @ 1 km

0.000708159983618

NDVI slope @ 2 km

0.000665016145593

NDVI slope @ 5 km

0.000477837621138

NDVI slope @ 10 km

0.000249099352484

NDVI slope @ 20 km

0.000138293453436


Temporal stability analysis

+000 deg (BHR)


BHR statistics

Temporal stability [1/decade]:


abs

rel


Weighted least square:

None


Ordinary least square:

None


Probabilities that GCOS criteria is met:

Weighted least square:

None %

Ordinary least square:

None %


DHR statistics

Temporal stability [1/decade]:


abs

rel


Weighted least square:

None


Ordinary least square:

None


Probabilities that GCOS criteria is met:

Weighted least square:

None %

Ordinary least square:

None %


+057/+063 deg (BHR)


BHR statistics

Temporal stability [1/decade]:


abs

rel


Weighted least square:

None


Ordinary least square:

None


Probabilities that GCOS criteria is met:

Weighted least square:

None %

Ordinary least square:

None %


DHR statistics

Temporal stability [1/decade]:


abs

rel


Weighted least square:

None


Ordinary least square:

None


Probabilities that GCOS criteria is met:

Weighted least square:

None %

Ordinary least square:

None %


Temporal anomaly analyis

The variance of the temporal anomalies provides an additional measure about the stability of the signal AFTER removal of the mean seasonal cylce.

+000 deg


+057/+063 deg