SUA_PAN2


Location

lon / lat [deg]: 25.956 / -20.881

Source network: ALBEDOVAL2


Geostationary surface albedo (GSA) data


“+000”


“+057/+063”


Landcover information (based on ESA CCI landcover data)


Landcover fractions @ 2km distance


Landcover fractions @ 20 km distance


Legend


Distance to open water bodies [km]:

0.14

Distance to urban areas [km]:

none in region


Radius: 1 km

Number of landcover classes:

1

Dominant landcover type:

210: water bodies

Fraction of dominant landcover type [%]:

100.0


Radius: 2 km

Number of landcover classes:

1

Dominant landcover type:

210: water bodies

Fraction of dominant landcover type [%]:

100.0


Radius: 5 km

Number of landcover classes:

1

Dominant landcover type:

210: water bodies

Fraction of dominant landcover type [%]:

100.0


Radius: 10 km

Number of landcover classes:

1

Dominant landcover type:

210: water bodies

Fraction of dominant landcover type [%]:

100.0


Radius: 20 km

Number of landcover classes:

3

Dominant landcover type:

210: water bodies

Fraction of dominant landcover type [%]:

89.0


Disturbances


Heterogeneity analysis

The heterogeneity analysis provides information about the spatial and temporal heterogeneity of the site.

Topography


Roman et al. (2009) index


St

20.9395686052

Rcv

0.0555057522234

Rse

0.0

Rst

0.0169886885503

Rsv

0.0707749864323


Height range @ 1km [m]

6

Height range @ 2km [m]

5

Height range @ 5km [m]

6

Height range @ 10km [m]

-999

Height range @ 20km [m]

-999


Variance slope @ 1 km

0

Variance slope @ 2 km

0

Variance slope @ 5 km

0

Variance slope @ 10 km

-999

Variance slope @ 20 km

-999


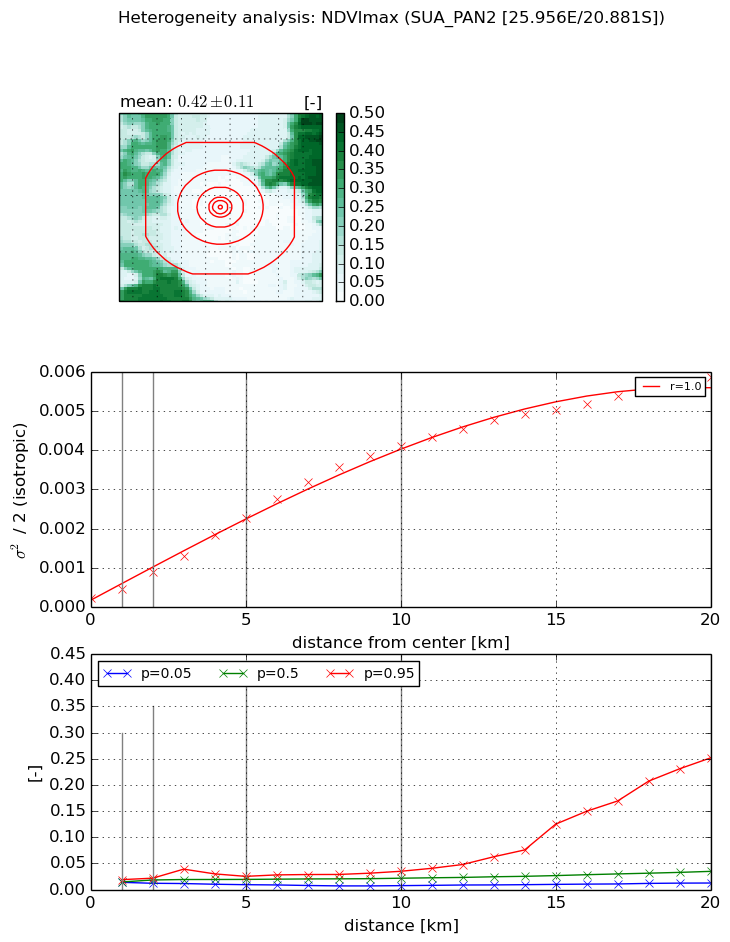
NDVI (max. NDVI composite)


Roman et al. (2009) index


St

1.12352443355

Rcv

-0.183647716871

Rse

0.0

Rst

1.7049377204

Rsv

-0.781583461965


NDVI range @ 1km [-]

0.01

NDVI range @ 2km [-]

0.01

NDVI range @ 5km [-]

0.02

NDVI range @ 10km [-]

0.03

NDVI range @ 20km [-]

0.24


Variance slope @ 1 km

0.000220759470638

Variance slope @ 2 km

0.000333570757932

Variance slope @ 5 km

0.000422818268075

Variance slope @ 10 km

0.000416153069639

Variance slope @ 20 km

0.000283827731433


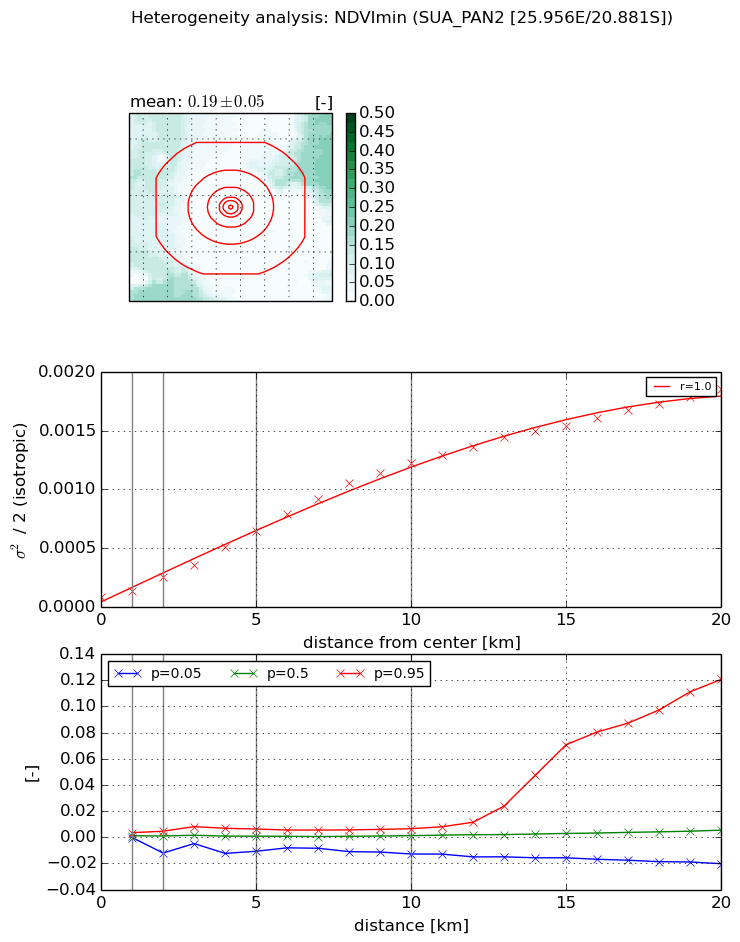
NDVI (min. NDVI composite)I


Roman et al. (2009) index


St

nan

Rcv

nan

Rse

nan

Rst

nan

Rsv

nan


NDVI range @ 1km [-]

0.0

NDVI range @ 2km [-]

0.02

NDVI range @ 5km [-]

0.02

NDVI range @ 10km [-]

0.02

NDVI range @ 20km [-]

0.14


NDVI slope @ 1 km

5.22879455837e-05

NDVI slope @ 2 km

8.30418315726e-05

NDVI slope @ 5 km

0.000114562858489

NDVI slope @ 10 km

0.0001226953046

NDVI slope @ 20 km

9.05385359278e-05


Temporal stability analysis

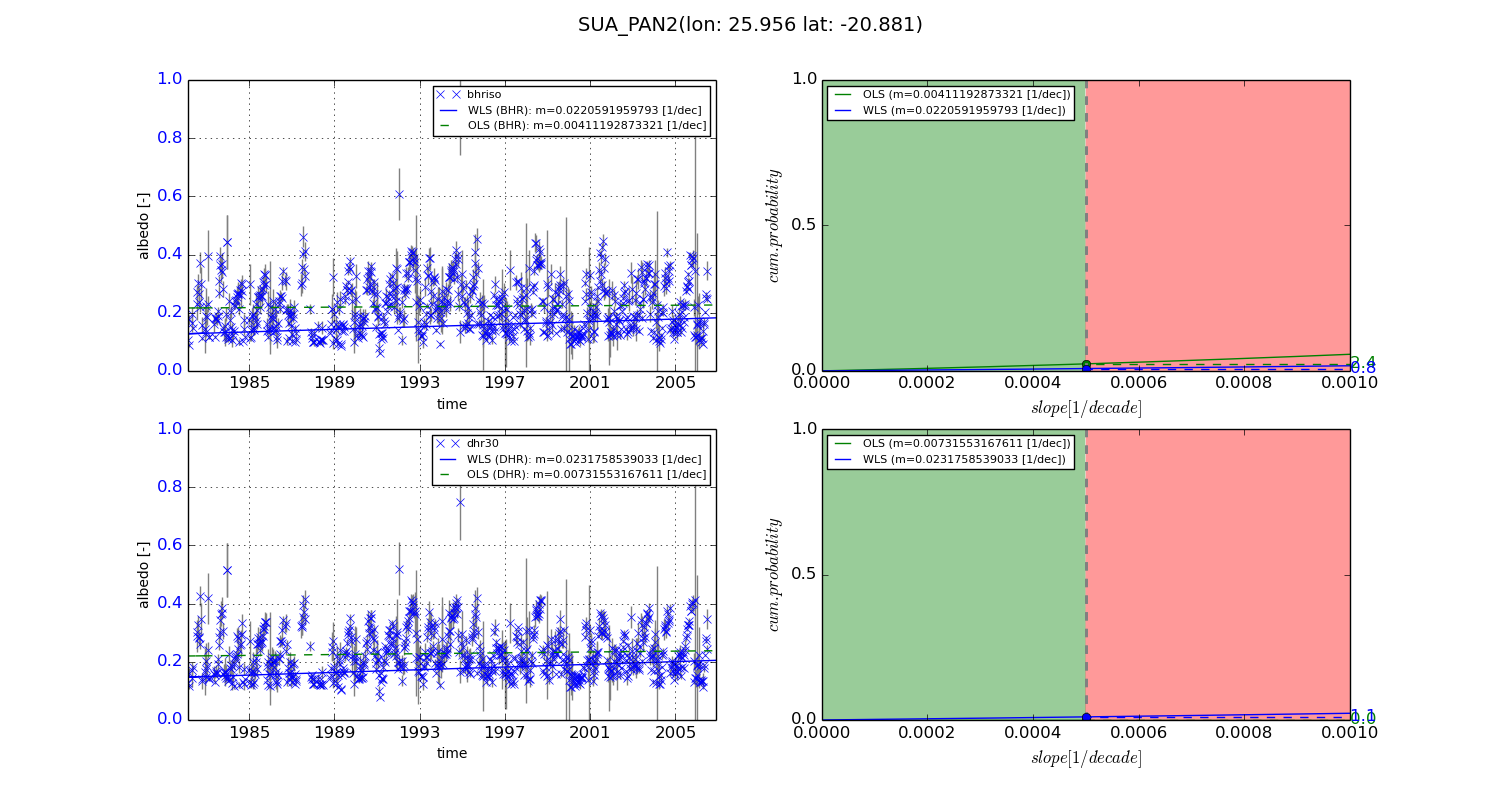
+000 deg (BHR)


BHR statistics

Temporal stability [1/decade]:


abs

rel


Weighted least square:

0.0220591959793


Ordinary least square:

0.00411192873321


Probabilities that GCOS criteria is met:

Weighted least square:

0.8 %

Ordinary least square:

2.4 %


DHR statistics

Temporal stability [1/decade]:


abs

rel


Weighted least square:

0.0231758539033


Ordinary least square:

0.00731553167611


Probabilities that GCOS criteria is met:

Weighted least square:

1.1 %

Ordinary least square:

0.0 %


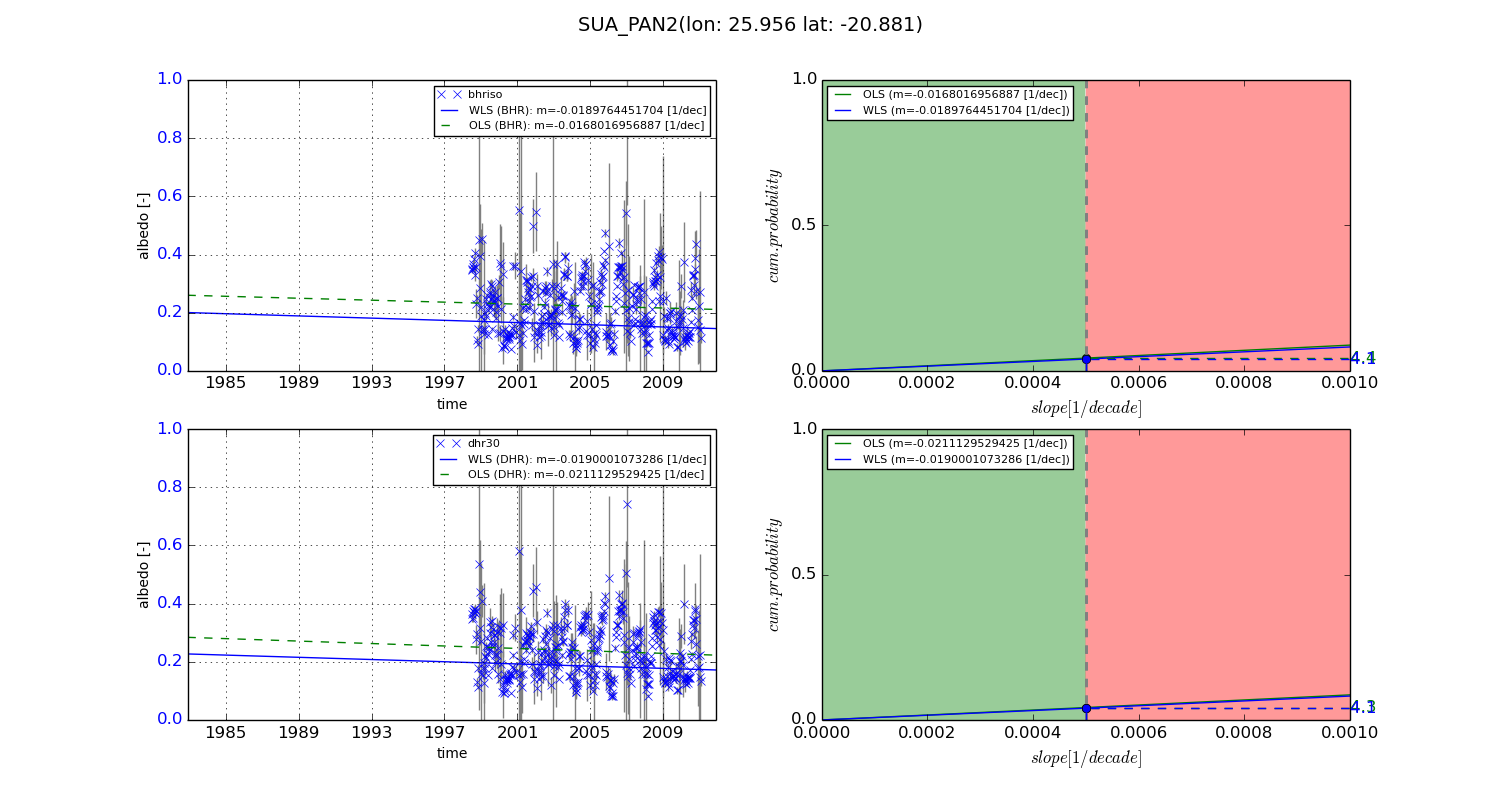
+057/+063 deg (BHR)


BHR statistics

Temporal stability [1/decade]:


abs

rel


Weighted least square:

-0.0189764451704


Ordinary least square:

-0.0168016956887


Probabilities that GCOS criteria is met:

Weighted least square:

4.1 %

Ordinary least square:

4.4 %


DHR statistics

Temporal stability [1/decade]:


abs

rel


Weighted least square:

-0.0190001073286


Ordinary least square:

-0.0211129529425


Probabilities that GCOS criteria is met:

Weighted least square:

4.1 %

Ordinary least square:

4.3 %


Temporal anomaly analyis

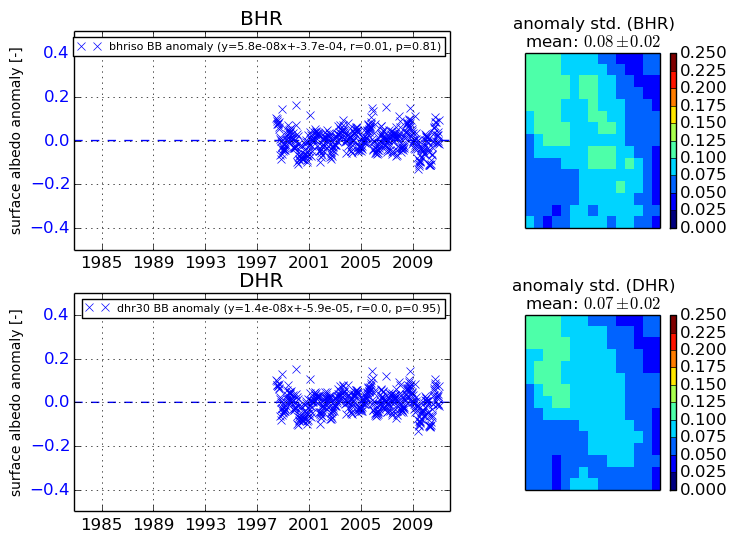
The variance of the temporal anomalies provides an additional measure about the stability of the signal AFTER removal of the mean seasonal cylce.
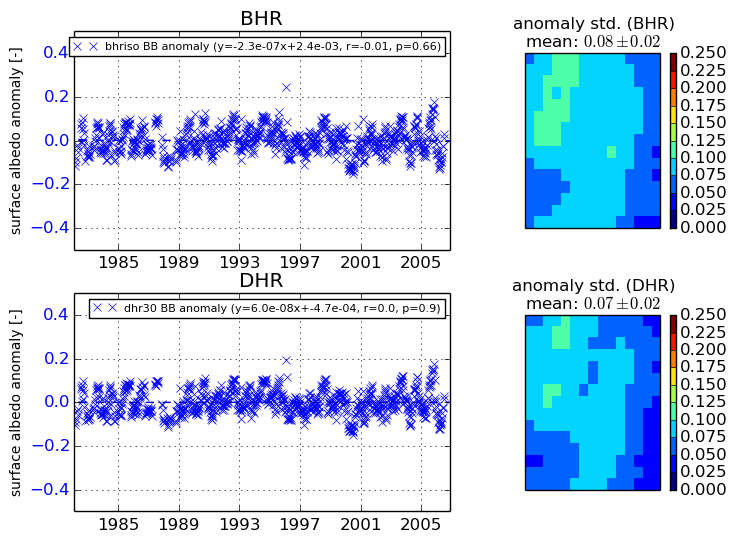
+000 deg


+057/+063 deg