TAM


Location

lon / lat [deg]: 5.5292 / 22.7903

Source network: BSRN


Geostationary surface albedo (GSA) data


“+000”


“+057/+063”


Landcover information (based on ESA CCI landcover data)


Landcover fractions @ 2km distance


Landcover fractions @ 20 km distance


Legend


Distance to open water bodies [km]:

none in region

Distance to urban areas [km]:

0.0


Radius: 1 km

Number of landcover classes:

1

Dominant landcover type:

190: urban areas

Fraction of dominant landcover type [%]:

100.0


Radius: 2 km

Number of landcover classes:

1

Dominant landcover type:

190: urban areas

Fraction of dominant landcover type [%]:

99.0


Radius: 5 km

Number of landcover classes:

2

Dominant landcover type:

200: bare areas

Fraction of dominant landcover type [%]:

60.0


Radius: 10 km

Number of landcover classes:

2

Dominant landcover type:

200: bare areas

Fraction of dominant landcover type [%]:

89.0


Radius: 20 km

Number of landcover classes:

2

Dominant landcover type:

200: bare areas

Fraction of dominant landcover type [%]:

97.0


Disturbances


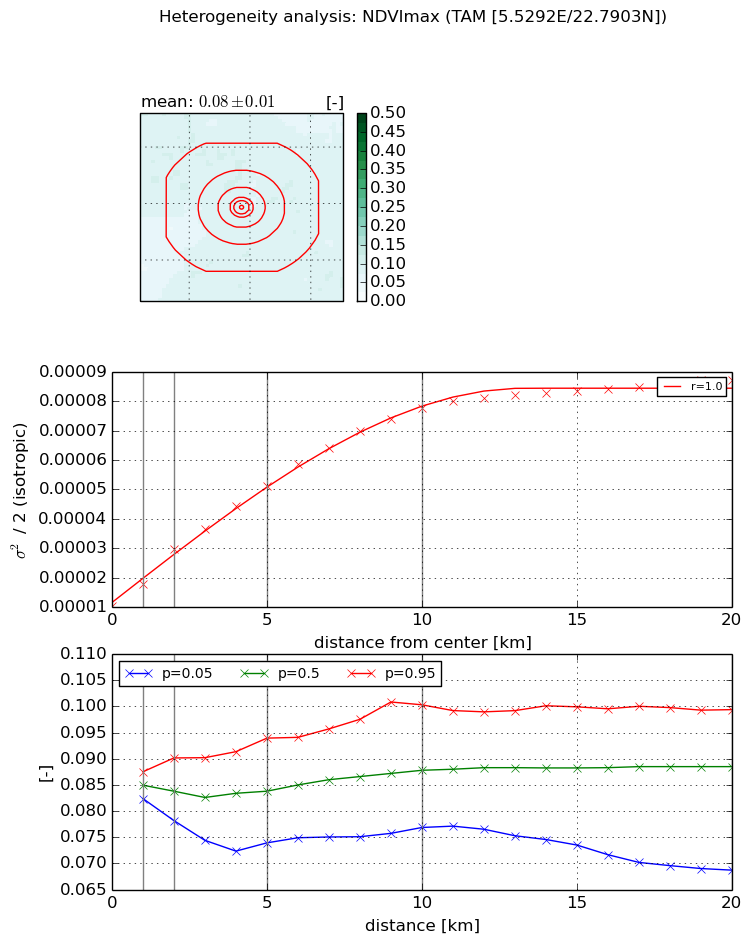
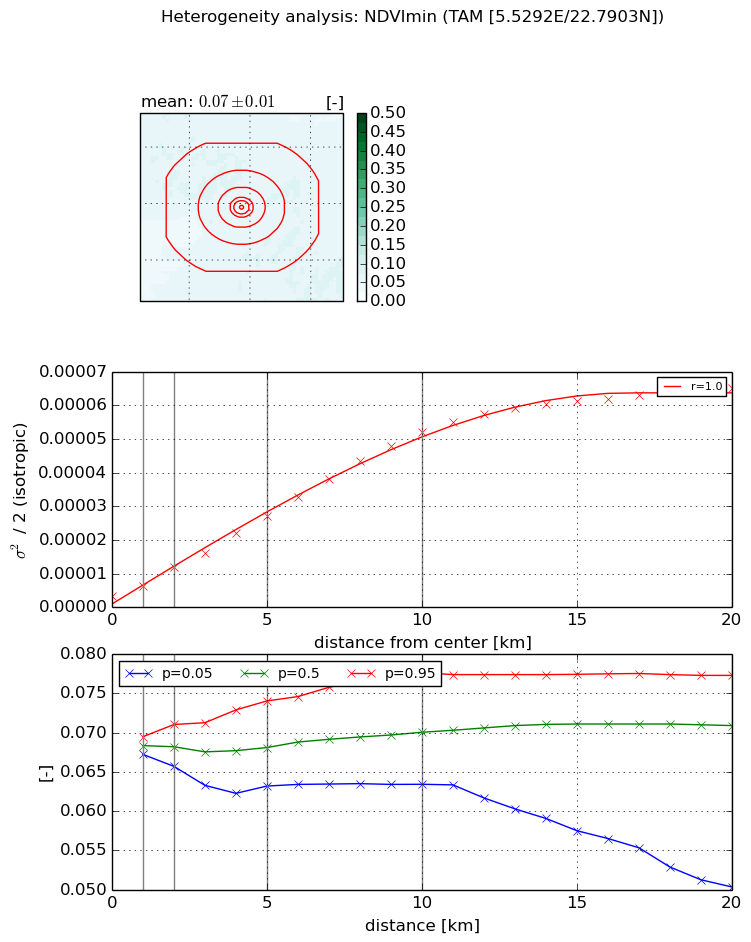
Heterogeneity analysis

The heterogeneity analysis provides information about the spatial and temporal heterogeneity of the site.

Topography


Roman et al. (2009) index


St

0.000468916998069

Rcv

0.855117873941

Rse

0.0

Rst

8.27820955985e-05

Rsv

6396.86553106


Height range @ 1km [m]

19

Height range @ 2km [m]

25

Height range @ 5km [m]

60

Height range @ 10km [m]

-999

Height range @ 20km [m]

-999


Variance slope @ 1 km

301

Variance slope @ 2 km

209

Variance slope @ 5 km

137

Variance slope @ 10 km

-999

Variance slope @ 20 km

-999


NDVI (max. NDVI composite)


Roman et al. (2009) index


St

5.60448466261

Rcv

0.222047713489

Rse

0.0

Rst

0.134029169483

Rsv

-0.179208728569


NDVI range @ 1km [-]

0.01

NDVI range @ 2km [-]

0.01

NDVI range @ 5km [-]

0.02

NDVI range @ 10km [-]

0.02

NDVI range @ 20km [-]

0.03


Variance slope @ 1 km

7.62335664126e-06

Variance slope @ 2 km

9.76901519108e-06

Variance slope @ 5 km

8.29339269093e-06

Variance slope @ 10 km

6.81910922975e-06

Variance slope @ 20 km

3.58648798348e-06


NDVI (min. NDVI composite)I


Roman et al. (2009) index


St

5.18484458595

Rcv

0.282050403447

Rse

0.0

Rst

0.0480248120694

Rsv

-0.24853422017


NDVI range @ 1km [-]

0.0

NDVI range @ 2km [-]

0.01

NDVI range @ 5km [-]

0.01

NDVI range @ 10km [-]

0.01

NDVI range @ 20km [-]

0.03


NDVI slope @ 1 km

2.90774838157e-06

NDVI slope @ 2 km

4.21393891124e-06

NDVI slope @ 5 km

4.82449363836e-06

NDVI slope @ 10 km

5.09560250443e-06

NDVI slope @ 20 km

3.26410140758e-06


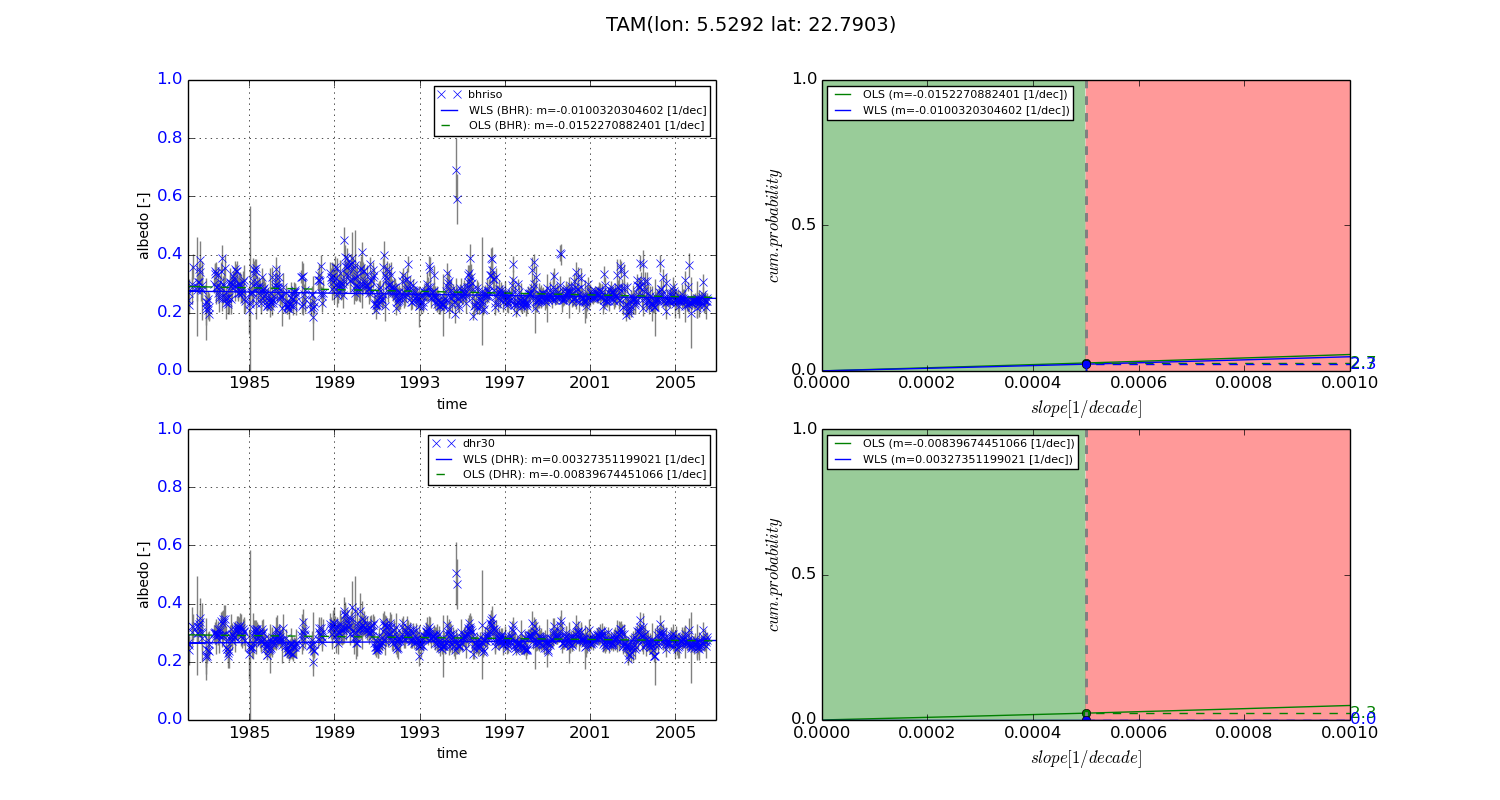
Temporal stability analysis

+000 deg (BHR)


BHR statistics

Temporal stability [1/decade]:


abs

rel


Weighted least square:

-0.0100320304602


Ordinary least square:

-0.0152270882401


Probabilities that GCOS criteria is met:

Weighted least square:

2.3 %

Ordinary least square:

2.7 %


DHR statistics

Temporal stability [1/decade]:


abs

rel


Weighted least square:

0.00327351199021


Ordinary least square:

-0.00839674451066


Probabilities that GCOS criteria is met:

Weighted least square:

0.0 %

Ordinary least square:

2.3 %


+057/+063 deg (BHR)


BHR statistics

Temporal stability [1/decade]:


abs

rel


Weighted least square:

-0.00998140236089


Ordinary least square:

-0.00621023814061


Probabilities that GCOS criteria is met:

Weighted least square:

2.9 %

Ordinary least square:

3.7 %


DHR statistics

Temporal stability [1/decade]:


abs

rel


Weighted least square:

-0.00821567818561


Ordinary least square:

-0.00336103585145


Probabilities that GCOS criteria is met:

Weighted least square:

3.2 %

Ordinary least square:

5.0 %


Temporal anomaly analyis

The variance of the temporal anomalies provides an additional measure about the stability of the signal AFTER removal of the mean seasonal cylce.
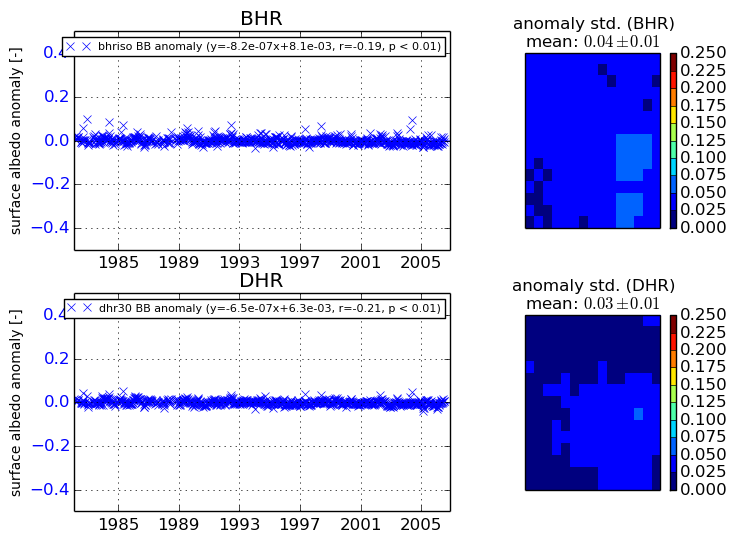
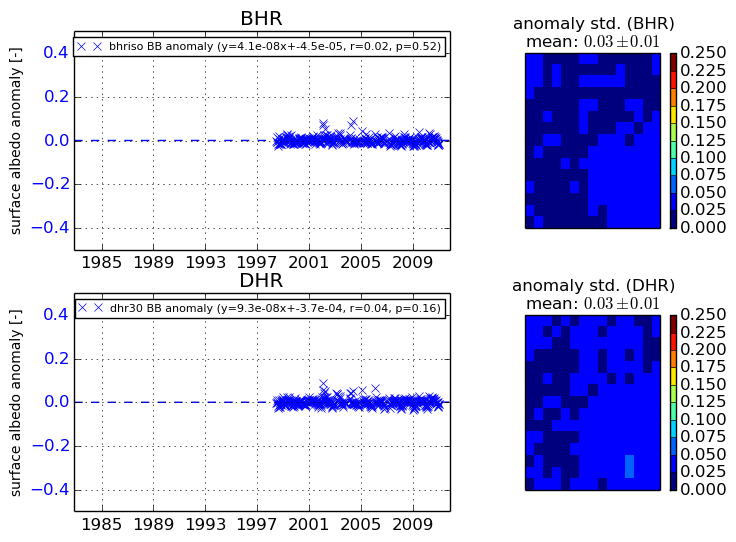
+000 deg


+057/+063 deg