TORONTO


Location

lon / lat [deg]: -79.47 / 43.97

Source network: AERONET


Geostationary surface albedo (GSA) data


“+000”


“+057/+063”


Landcover information (based on ESA CCI landcover data)


Landcover fractions @ 2km distance


Landcover fractions @ 20 km distance


Legend


Distance to open water bodies [km]:

2.91

Distance to urban areas [km]:

0.11


Radius: 1 km

Number of landcover classes:

4

Dominant landcover type:

190: urban areas

Fraction of dominant landcover type [%]:

60.0


Radius: 2 km

Number of landcover classes:

5

Dominant landcover type:

190: urban areas

Fraction of dominant landcover type [%]:

59.0


Radius: 5 km

Number of landcover classes:

8

Dominant landcover type:

190: urban areas

Fraction of dominant landcover type [%]:

36.0


Radius: 10 km

Number of landcover classes:

7

Dominant landcover type:

10: cropland, rainfed

Fraction of dominant landcover type [%]:

26.0


Radius: 20 km

Number of landcover classes:

7

Dominant landcover type:

10: cropland, rainfed

Fraction of dominant landcover type [%]:

28.0


Disturbances


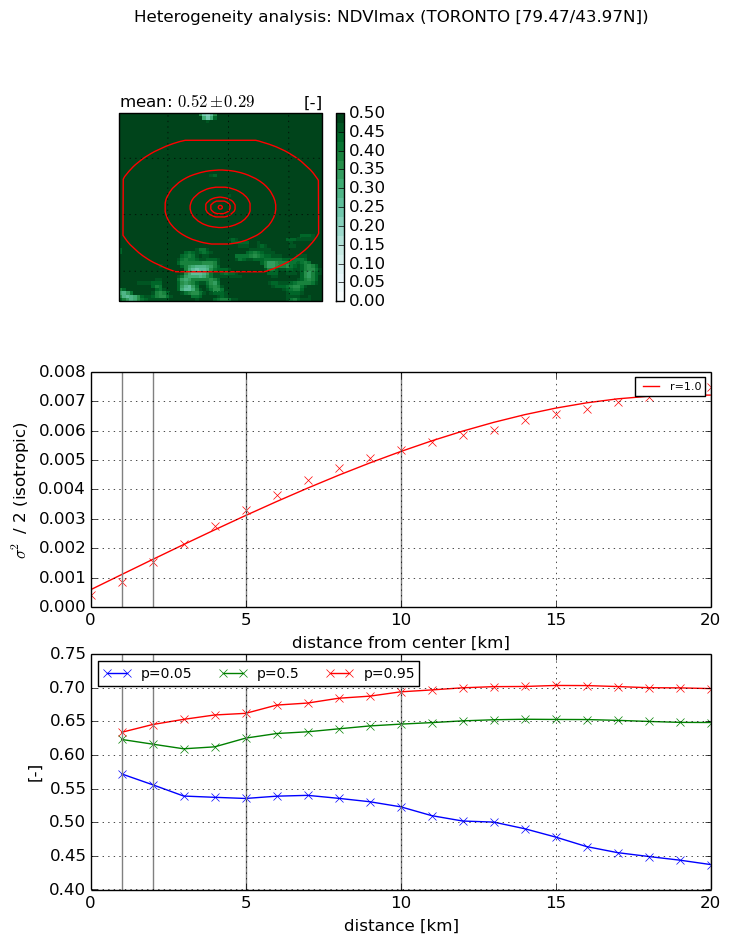
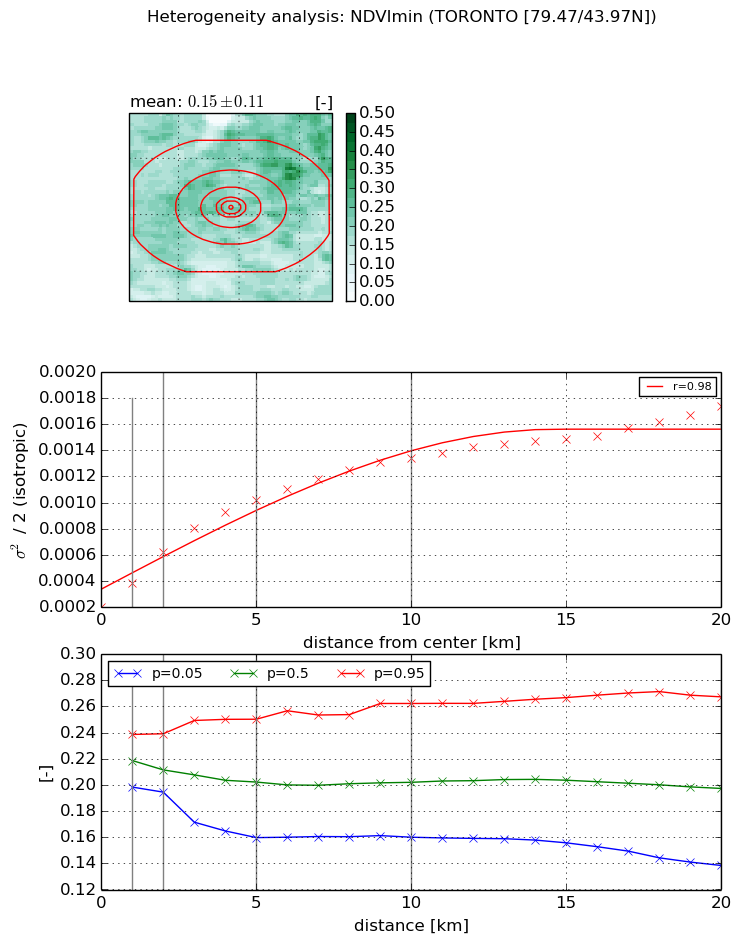
Heterogeneity analysis

The heterogeneity analysis provides information about the spatial and temporal heterogeneity of the site.

Topography


Roman et al. (2009) index


St

3.28098296117

Rcv

0.174859374602

Rse

0.0

Rst

-0.0803204390221

Rsv

0.659180314272


Height range @ 1km [m]

37

Height range @ 2km [m]

49

Height range @ 5km [m]

63

Height range @ 10km [m]

-999

Height range @ 20km [m]

-999


Variance slope @ 1 km

83

Variance slope @ 2 km

93

Variance slope @ 5 km

93

Variance slope @ 10 km

-999

Variance slope @ 20 km

-999


NDVI (max. NDVI composite)


Roman et al. (2009) index


St

3.22574312974

Rcv

0.214081706091

Rse

0.0

Rst

-0.117713455372

Rsv

0.598223094591


NDVI range @ 1km [-]

0.06

NDVI range @ 2km [-]

0.09

NDVI range @ 5km [-]

0.13

NDVI range @ 10km [-]

0.17

NDVI range @ 20km [-]

0.26


Variance slope @ 1 km

0.000454065034559

Variance slope @ 2 km

0.000563133433115

Variance slope @ 5 km

0.000595522437468

Variance slope @ 10 km

0.000514057322257

Variance slope @ 20 km

0.000346447718781


NDVI (min. NDVI composite)I


Roman et al. (2009) index


St

4.75606381589

Rcv

0.249778535877

Rse

0.0

Rst

-0.0491930888495

Rsv

0.331802081458


NDVI range @ 1km [-]

0.04

NDVI range @ 2km [-]

0.04

NDVI range @ 5km [-]

0.09

NDVI range @ 10km [-]

0.1

NDVI range @ 20km [-]

0.13


NDVI slope @ 1 km

0.000181891629057

NDVI slope @ 2 km

0.00020939647165

NDVI slope @ 5 km

0.000169300493369

NDVI slope @ 10 km

0.000110667194667

NDVI slope @ 20 km

6.34309462461e-05


Temporal stability analysis

+000 deg (BHR)


BHR statistics

Temporal stability [1/decade]:


abs

rel


Weighted least square:

None


Ordinary least square:

None


Probabilities that GCOS criteria is met:

Weighted least square:

None %

Ordinary least square:

None %


DHR statistics

Temporal stability [1/decade]:


abs

rel


Weighted least square:

None


Ordinary least square:

None


Probabilities that GCOS criteria is met:

Weighted least square:

None %

Ordinary least square:

None %


+057/+063 deg (BHR)


BHR statistics

Temporal stability [1/decade]:


abs

rel


Weighted least square:

None


Ordinary least square:

None


Probabilities that GCOS criteria is met:

Weighted least square:

None %

Ordinary least square:

None %


DHR statistics

Temporal stability [1/decade]:


abs

rel


Weighted least square:

None


Ordinary least square:

None


Probabilities that GCOS criteria is met:

Weighted least square:

None %

Ordinary least square:

None %


Temporal anomaly analyis

The variance of the temporal anomalies provides an additional measure about the stability of the signal AFTER removal of the mean seasonal cylce.

+000 deg


+057/+063 deg