TOULOUSE1


Location

lon / lat [deg]: 1.4764 / 43.5619

Source network: AERONET


Geostationary surface albedo (GSA) data


“+000”


“+057/+063”


Landcover information (based on ESA CCI landcover data)


Landcover fractions @ 2km distance


Landcover fractions @ 20 km distance


Legend


Distance to open water bodies [km]:

3.16

Distance to urban areas [km]:

0.06


Radius: 1 km

Number of landcover classes:

1

Dominant landcover type:

190: urban areas

Fraction of dominant landcover type [%]:

100.0


Radius: 2 km

Number of landcover classes:

2

Dominant landcover type:

190: urban areas

Fraction of dominant landcover type [%]:

95.0


Radius: 5 km

Number of landcover classes:

3

Dominant landcover type:

190: urban areas

Fraction of dominant landcover type [%]:

76.0


Radius: 10 km

Number of landcover classes:

3

Dominant landcover type:

190: urban areas

Fraction of dominant landcover type [%]:

56.0


Radius: 20 km

Number of landcover classes:

2

Dominant landcover type:

10: cropland, rainfed

Fraction of dominant landcover type [%]:

68.0


Disturbances


Heterogeneity analysis

The heterogeneity analysis provides information about the spatial and temporal heterogeneity of the site.

Topography


Roman et al. (2009) index


St

21.108852414

Rcv

0.0244808150822

Rse

0.0

Rst

-0.0855415918282

Rsv

-0.0320980618463


Height range @ 1km [m]

14

Height range @ 2km [m]

68

Height range @ 5km [m]

93

Height range @ 10km [m]

-999

Height range @ 20km [m]

-999


Variance slope @ 1 km

309

Variance slope @ 2 km

302

Variance slope @ 5 km

220

Variance slope @ 10 km

-999

Variance slope @ 20 km

-999


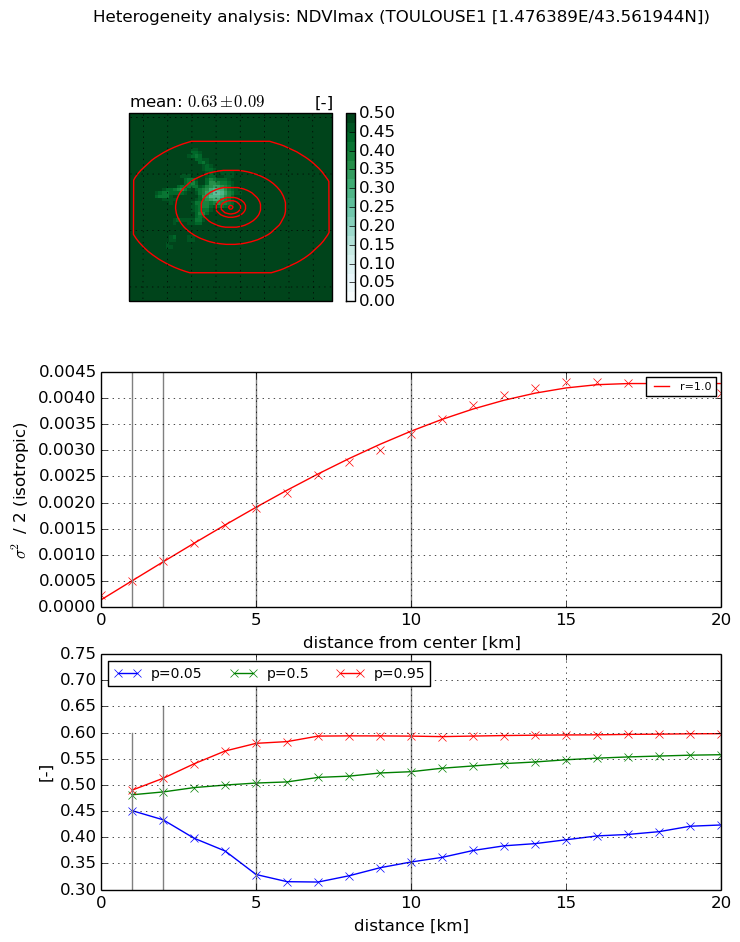
NDVI (max. NDVI composite)


Roman et al. (2009) index


St

1.69278853955

Rcv

0.664170569095

Rse

0.0

Rst

-0.10805323636

Rsv

-0.999999912934


NDVI range @ 1km [-]

0.04

NDVI range @ 2km [-]

0.08

NDVI range @ 5km [-]

0.25

NDVI range @ 10km [-]

0.24

NDVI range @ 20km [-]

0.17


Variance slope @ 1 km

0.000262729250167

Variance slope @ 2 km

0.00032190760021

Variance slope @ 5 km

0.000339621730626

Variance slope @ 10 km

0.000312424681212

Variance slope @ 20 km

0.000214104304717


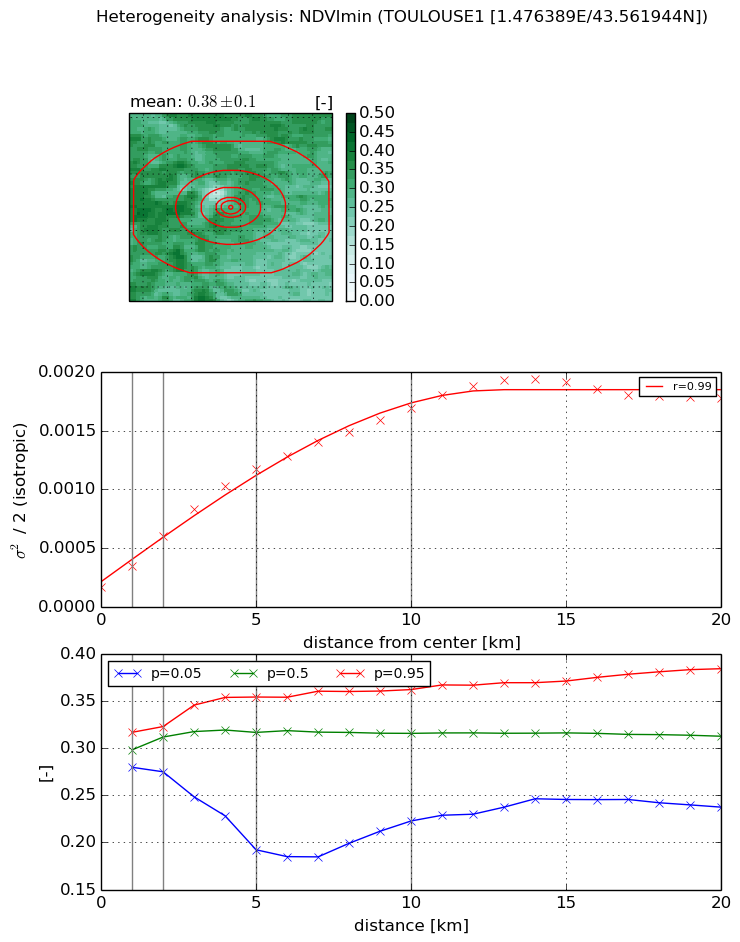
NDVI (min. NDVI composite)I


Roman et al. (2009) index


St

1.80542740033

Rcv

0.543238526287

Rse

0.0

Rst

-0.11848407215

Rsv

-0.999933804609


NDVI range @ 1km [-]

0.04

NDVI range @ 2km [-]

0.05

NDVI range @ 5km [-]

0.16

NDVI range @ 10km [-]

0.14

NDVI range @ 20km [-]

0.15


NDVI slope @ 1 km

0.000185236808153

NDVI slope @ 2 km

0.000220022282673

NDVI slope @ 5 km

0.000208385902434

NDVI slope @ 10 km

0.000150967080187

NDVI slope @ 20 km

7.67434910187e-05


Temporal stability analysis

+000 deg (BHR)


BHR statistics

Temporal stability [1/decade]:


abs

rel


Weighted least square:

-99999.0


Ordinary least square:

-99999.0


Probabilities that GCOS criteria is met:

Weighted least square:

-99999.0 %

Ordinary least square:

-99999.0 %


DHR statistics

Temporal stability [1/decade]:


abs

rel


Weighted least square:

-99999.0


Ordinary least square:

-99999.0


Probabilities that GCOS criteria is met:

Weighted least square:

-99999.0 %

Ordinary least square:

-99999.0 %


+057/+063 deg (BHR)


BHR statistics

Temporal stability [1/decade]:


abs

rel


Weighted least square:

-99999.0


Ordinary least square:

-99999.0


Probabilities that GCOS criteria is met:

Weighted least square:

-99999.0 %

Ordinary least square:

-99999.0 %


DHR statistics

Temporal stability [1/decade]:


abs

rel


Weighted least square:

-99999.0


Ordinary least square:

-99999.0


Probabilities that GCOS criteria is met:

Weighted least square:

-99999.0 %

Ordinary least square:

-99999.0 %


Temporal anomaly analyis

The variance of the temporal anomalies provides an additional measure about the stability of the signal AFTER removal of the mean seasonal cylce.

+000 deg


+057/+063 deg